what changed in the app since July
September 7th 2026 · The Philosopher Investor
2026-09-07 · 5 min read · Originally published on Substack ↗

Hello my friends,
The last time I wrote to you about the app was July 16, when Congress trades landed. Since then we shipped more than a hundred updates.
Here are the ten that matter most, biggest first. Every clip is the live app.
1. NEW: the chart, rebuilt

A full charting workspace on every name. 80+ studies, drawings saved per timeframe, ten layouts, replay, formulas.
A few use-cases to get you started:
Turn on Value zones: the volume profile draws the value area and the point of control. Support and resistance, no line to draw.
Turn on Dealer walls: the strikes where option hedging piles up. The ceiling and the floor of the week, on the chart.
Draw a trend line, right-click, make it an alert. Add a condition: RS rating above 90, or a close above the 50-day. It fires only when the break comes from a strong name.
Replay a past window bar by bar and test your entry.
Missing an indicator you use? Reply to this email. We add it.
2. NEW: Market Wizards, as screens

The 74 traders from Jack Schwager’s five books, each turned into a screen that runs every night.
Minervini’s Trend Template: price above the 50, 150 and 200-day, stacked in order, near the high, RS in the top quartile.
Paul Tudor Jones, Ed Seykota, Kovner, Druckenmiller, O’Neil, Dalio, Thorp, Greenblatt: one card each, the rules, tonight’s names, and which other wizards’ screens each name also clears.
Published rules where the trader wrote them. Our reading where he did not. The card says which.
At the top: the consensus, the names that clear several masters’ screens at once.
3. NEW: any list as a wall of charts
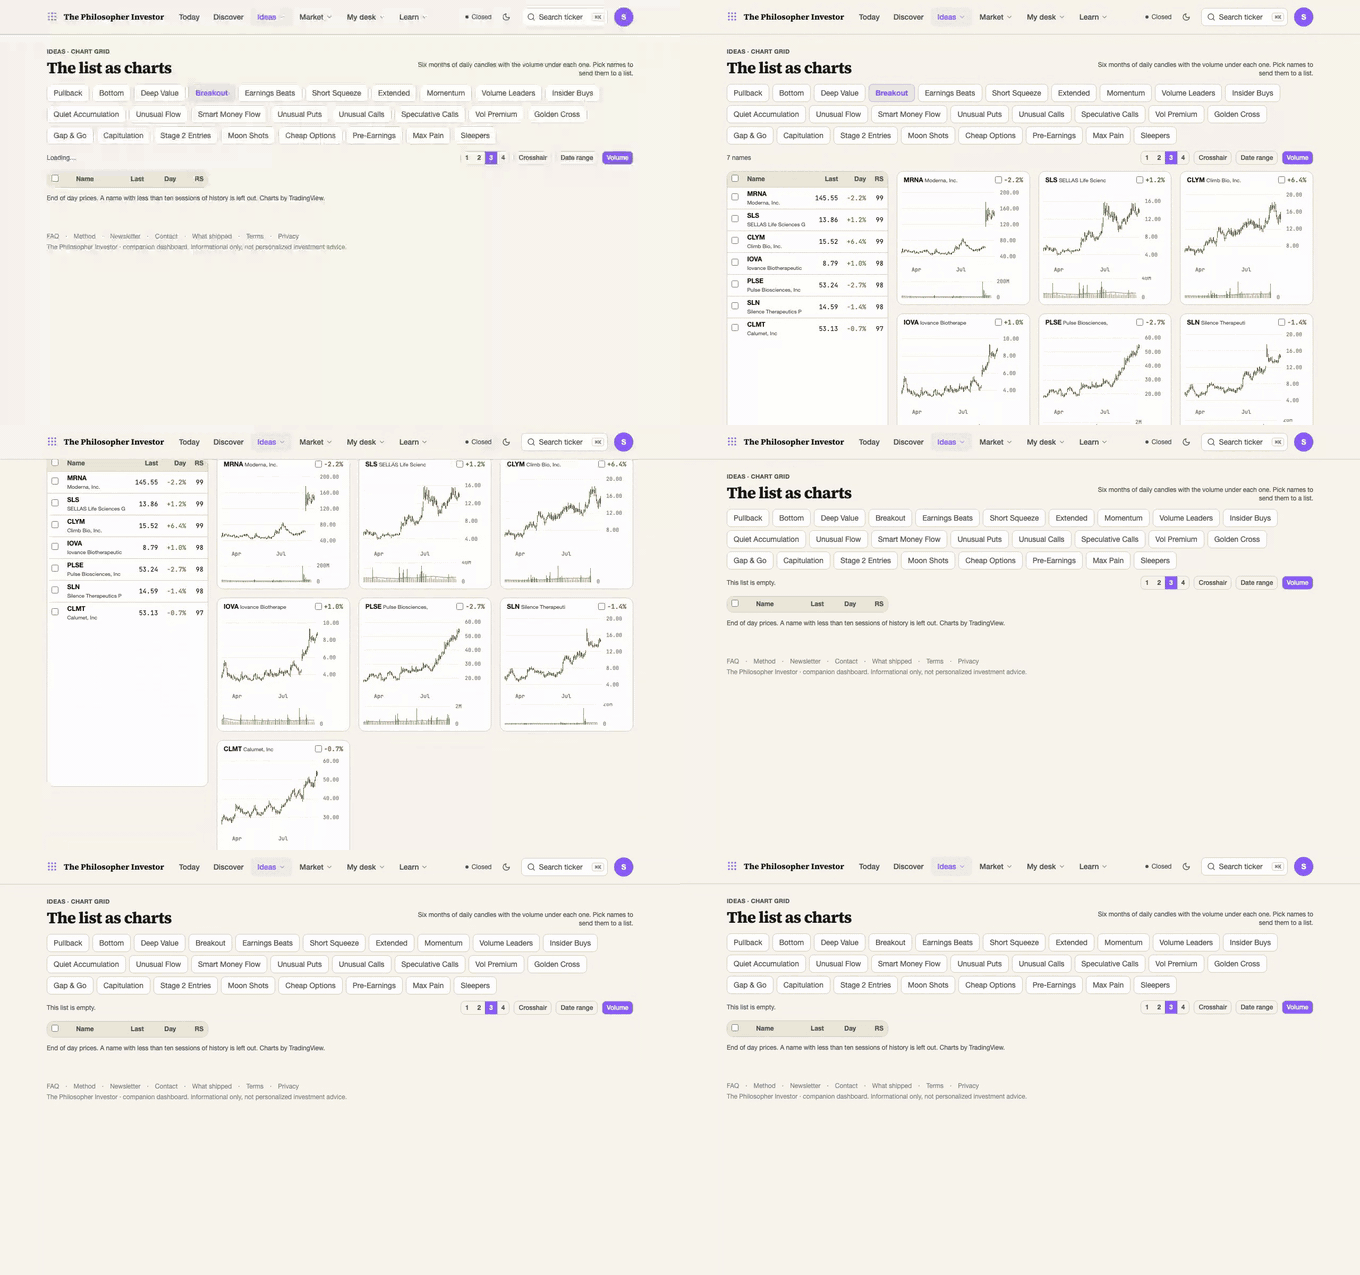
Pick a screener or one of your lists. Every name becomes a chart.
Each chart shows six months of daily candles, with volume under it. Two to four charts per row.
Scroll, stop on the ones that look right, tick them, send them to a list.
Thirty charts in one minute, on one page.
Start your 7-day free trial. Then $20 a month or $200 a year.
4. NEW: new highs and new lows, by sector and industry

Every stock at a 52-week high or low tonight, grouped by sector or by industry.
Which sectors print the highs, which print the lows, with the tickers behind each count.
Three months of history under the bar: is tonight normal or rare?
Filter by liquidity: all stocks, $10M a day, $50M a day.
5. The dealer map, second version

Gamma or delta, one toggle.
Dealer gamma charted on SPY, QQQ and IWM over the last three months.
The cushion through time: the share of option books in positive gamma. Thinning line, thinning shock absorber.
NEW: the gamma grid, strike by expiration. See which expiry carries the wall and when it rolls off.
6. One stock, the full file

New on every name page:
Premium drift: three months of call premium against put premium, session by session, with open interest through time under it.
Capital structure: cash, debt, net debt, enterprise value, and the debt maturity ladder from the last 10-K.
The competitive moat, argued from the filed facts. Five threat scores, a radar, plain English.
What growth the price already pays for, solved backwards from the last close.
Record volume flagged the day a name trades more shares than ever in our records.
7. The screeners, sharper

Type it in plain English: “cheap tech with insider buying” lands on the exact filters, as chips you can remove.
A strength rating on every row of every screener.
An earnings filter on every screener: about to report, just reported, neither. Every date says before the open or after the close.
NEW sheets: options stats (realized vs implied vol, put/call, correlation to the S&P) and performance (the whole market ranked over six windows).
NEW: Scatter. Any two fundamentals metrics, the biggest 250 names or your watchlist, with the fit line.
Insider dollars over 90 days and distinct insiders buying, as columns and as a filter.
8. Where the volume hides

Four NEW alt-data pages, and the same signals on every name page.
Dark pool: the share of volume printed off-exchange, and how much of it was sold short, with the trend.
Government contracts: who just won federal money, ranked by dollars, with the agency.
Activist filings: every fresh 13D, a 5%+ active stake.
Retail attention: the jump in a name’s Wikipedia traffic, seven days against the prior four weeks.
Buybacks: ranked by shares actually retired, not programs announced.
9. The macro desk

NEW Odds desk: what Polymarket and Kalshi price on a Fed hike, a recession, inflation and jobs. The 24-hour move, and the names most exposed to each question.
NEW futures positioning: hedge funds, asset managers and dealers on S&P futures, ten years back, this week’s shift, the percentile.
Short interest read the right way: days of volume to cover across the whole market, against its own range.
Central banks on one table: Fed, ECB, BOE, BOJ, BOC, RBA, last move, spread to the Fed, plus the Fed balance sheet over five years.
CPI, jobs, PCE, GDP and Fed days on the earnings calendar, next to who reports.
FX and rates: the dollar, seventeen pairs, the full Treasury curve against a month and a year ago.
Sector momentum breadth: per sector, how many names still hold a strong 30-day run, against the index.
10. The crypto radar

Crypto read like equities.
Bitcoin and Ethereum: 7-day, 30-day, 1-year moves, fear and greed, dominance, how the coins trade against SPY and QQQ.
Stress dials: funding percentile, sentiment streak, dry powder in stablecoins, majors above their 50-day, each against its own multi-year history.
NEW: funding on the 25 biggest perpetuals, how crowded versus its history back to 2019, open interest with the one-day and one-week change.
Movers over 24 hours and 7 days, tokenomics, a coin comparator, a coin map.
Follow coins, set price alerts on them.
That is ten. The other are in the app, and every new one lands in the changelog the day it ships.
Start your 7-day free trial. Then $20 a month or $200 a year.
Daniel
Read the desk every week
Market analysis in plain English, plus the app that scans the whole US market for you.
Become a member Read the original on Substack ↗