new in the app: the options stat sheet
2,100 names with real options flow on one page
2026-09-12 · 3 min read · Originally published on Substack ↗

Hello my friends,
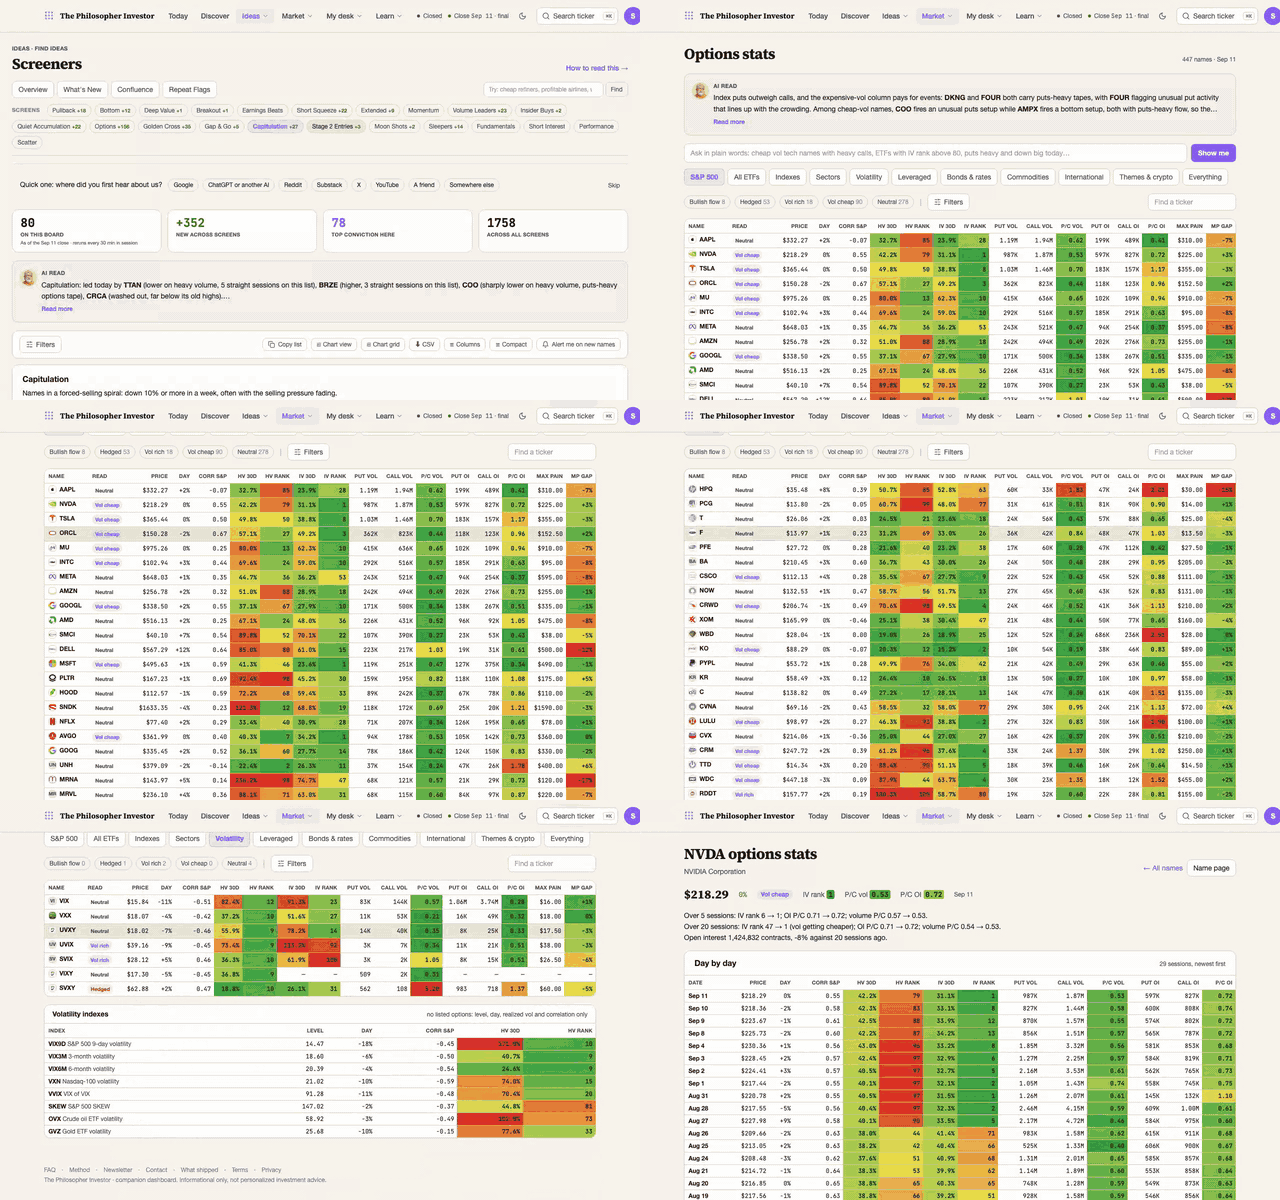
One feature today, the newest in the app: the options stat sheet. One line per name, every night: realized and implied volatility, put/call on the day’s volume and on open interest, max pain. About 2,100 names with real options flow, the S&P 500, the ETFs and the index options. It comes from a table I have followed for years.
It is live now in the app for paid subscribers.
Link: app.thephilosopherinvestor.com/options-stats.
How to read it
HV 30d, IV 30d. How much the stock moved over 30 sessions, and how much its options charge for the next 30. Implied above realized for months: the options are dearer than the stock’s movement justifies, the seller’s edge. The trap is earnings: implied climbs into the report and collapses after it, so a call bought there can lose even when the stock moves your way.
HV rank, IV rank. The same numbers placed in the name’s own range, 0 to 100. HV rank uses the past year; IV rank uses the implied history we hold, which starts in March for most names and fills toward a year every night. Under 10 is cheap for that name, above 80 is dear. The table’s rule: buy volatility only under 10, sell it only when it is high and already turning down. Never on the way up.
Corr S&P. The 30-day correlation to the index. Near 1, the index moves the name and hedges it. Near 0, the name has its own story.
P/C vol. Today’s put volume over call volume. One day is a mood, and one large trade can push it anywhere. The change is the signal: 0.8 to 2 means something is wrong, five days rising means somebody knows something.
P/C OI. Put open interest over call open interest, the positions still alive. Slow, and the one that counts. From 0.8 to 1.8 is significant. Above 3 with volume above 2 is the sheet’s most bearish screen. Above 4 is extreme hedging. Under 0.21 with volume under 0.5 is the most bullish: nothing but calls.
The pattern the table exists for. Volume put/call rising five days, open-interest put/call rising, implied vol picking up with its rank past 80, short interest rising if you can see it. Together, they have come before failed trials, pre-announcements, resignations, accounting problems.
At the extremes, read the other way. Put/call moves with the VIX, it does not lead it. Its use is as an overbought and oversold gauge: a put spike on a rally day, with puts traded by the million, is more often a bottom than a top. The protection has already been bought.
Max pain, MP gap. For the nearest expiration, the strike where the open calls and puts together are worth the least, and the distance from the last price. Heavy open interest tends to pin there into the last days. A pull, not a target.
Read, and day by day. One word per row from the thresholds above, strict so it stays rare. Click a name: the same sheet one line per session, the chain by expiration with max pain, implied against realized on a chart. That is where the trend lives.
Ask it in plain words
The box at the top fills the filters for you. For example:
“cheap vol tech names with heavy calls”
“sector ETFs puts heavy”
“IV rank above 80 and down big today”
Want access? It is in our app, included in the paid Substack tier, with a 7 day free trial.
Daniel
Read the desk every week
Market analysis in plain English, plus the app that scans the whole US market for you.
Become a member Read the original on Substack ↗