The Index Is 1% From Its High. The Market Under It Is Already Correcting.
Market Recap — August 6th 2026 · The Philosopher Investor
2026-09-06 · 12 min read · Originally published on Substack ↗
Hello my friends,
Two Sundays without a letter, so this one carries three weeks. I was on vacation in Mexico and the trip ran longer than planned, which is why you have not heard from me. I am back now and the editions resume their Sunday rhythm. I also shipped a set of new features on the paid app and will send a separate email about them. Back to the market.
The market spent three weeks arguing about the price of money, and Friday settled the argument. The jobs report printed 162,000 against expectations of a third of that, and a Fed hike this month went from unlikely to more likely than not. Energy is the one trade that never needed the argument, and it kept leading. Everything else in this letter is about what dearer money does to the average stock before the index notices, and why the S&P can sit near its record while most of what is inside it retreats. The trade at the bottom buys a company the market has already punished for it, with four of its directors buying alongside.

Get the app. Every subscriber gets this letter. Paid readers also get the app it is written on.
What is inside:
Twenty-six screeners. They run every night on 12,000+ US stocks: pullbacks, breakouts, bottoms, squeezes, insider clusters, unusual options flow.
Sectors and themes. Which corners of the market lead and which lag against the S&P, which way each one is turning, and twenty-six themes tracked basket by basket: AI agents, defense tech, drones, critical minerals, the power grid, fintech.
Where the market stands. Breadth, rates and inflation, the dollar and the curve, commodities, crypto, and the sentiment gauges, all rebuilt after every close.
Who is buying. 13F books from 100+ funds, activist stakes, Congress disclosures, insider clusters, buybacks, federal contracts.
Your desk. Build your watchlist, set your price alerts, analyze your positions, keep your trading journal, and size your next trade.
The Academy, our private trading course. 35 lessons that take you from reading a chart to sizing a trade and a guide to every page in the app.
Start your 7-day free trial. Then $20 a month or $200 a year.
📊 Market Health
The market has been correcting for three weeks under an index that has barely moved, and the order in which a higher short rate reaches companies explains both halves. When the front end of the curve reprices for a hike, the average stock pays first, because it carries more floating debt, refinances sooner and is valued on next year's earnings, while the largest companies fund themselves and buy back their own shares. That is why my market health score, which weighs six thousand stocks equally, went from 73 on August 14 to 36 on August 28 and recovered only to 44 this Friday, still labeled weak, while the S&P never closed more than two percent below its record over the same three weeks and ended this Friday one percent under it. The recovery from 36 came from the new-high list, which is dominated by energy names, international funds and short-duration bond funds, the places money has been hiding, and the advance-decline work did not join it: this Friday closed with as many decliners as advancers even as the Nasdaq rose. So the index and the average stock have separated, and the flows that separated them left the middle of the market, where most portfolios live, for the handful of names that hold the index up and for cash.
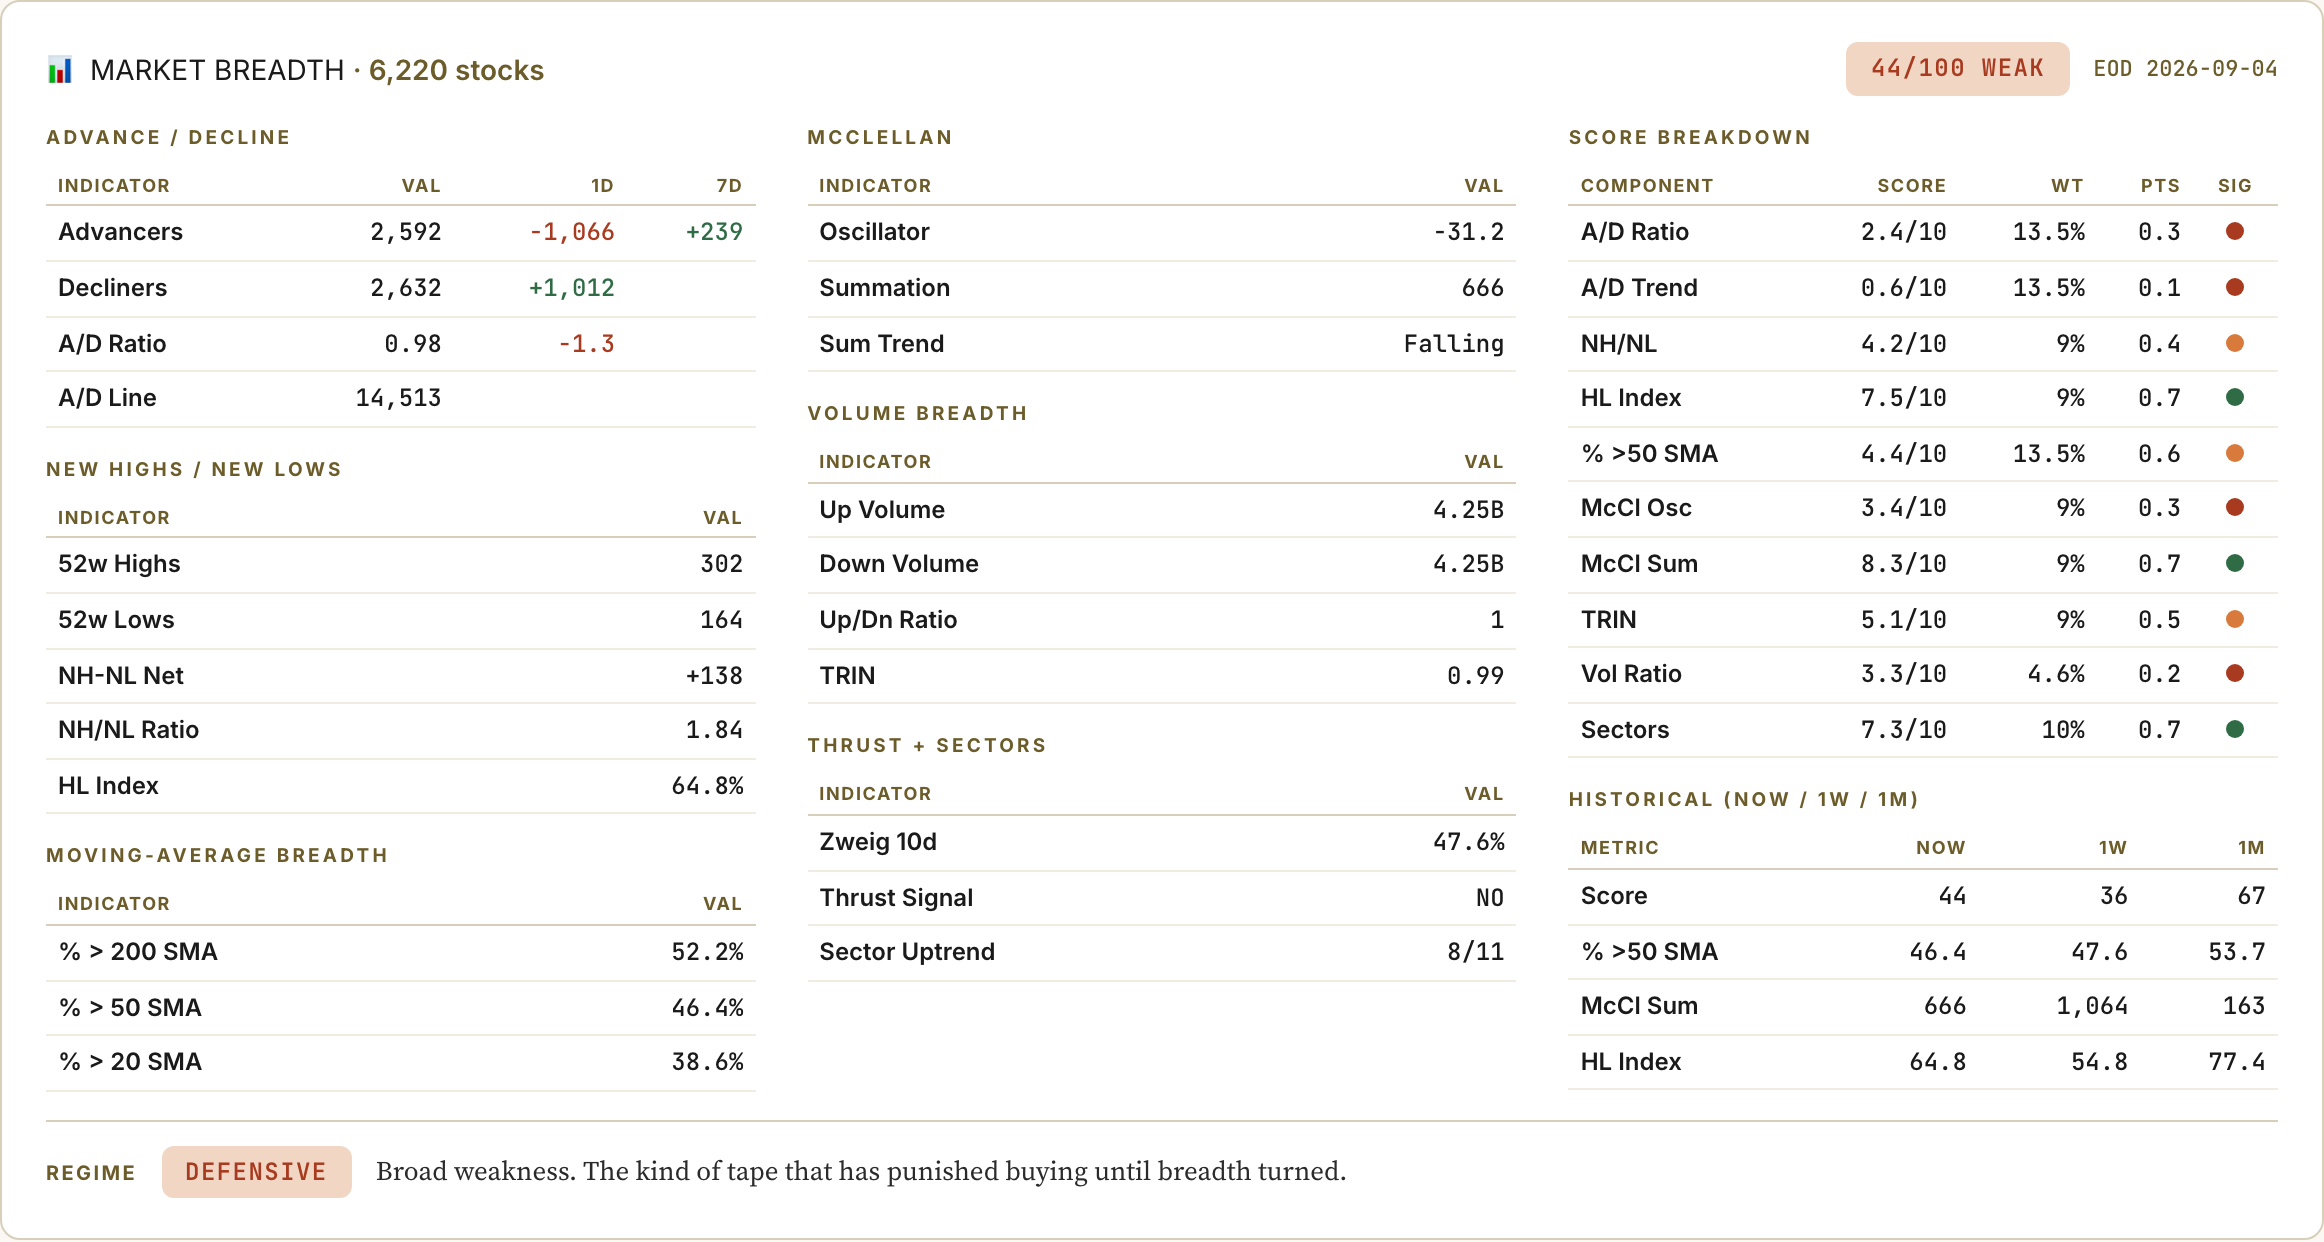
The McClellan summation tells the same story with dates. It read 258 when I last wrote, climbed for two more weeks to 1,064 on August 28 as the rally broadened into late August, then gave back four hundred points to 666 in the five sessions since, which is the shape of a market that lost the average stock the moment the 2-year yield turned up on the Warsh speech. The share of stocks above their 200-day average fell from 56% to 52% over the three weeks, the share above the 50-day from 58% to 46%, and only 39% hold above the 20-day, so the long trend is intact, the medium trend is breaking and the short trend is broken, the ordering of a correction that started underneath an index that has not registered it. The sequence of the week confirms who is in charge: Monday and Tuesday sold off as the 10-year pushed toward 4.8% on renewed US strikes on Iran and the oil bid, Thursday made the week, and Friday's payroll surprise took a third of Thursday back. The index finished flat and the equal-weight S&P lost 0.8%, so the version of the market most people own went down in a week the headline said nothing happened.
🚨 Sector Rotation
Three sectors hold a majority of their members above the 50-day average, down from nine three weeks ago, and none of the three is what carried the index this year.
Energy has had the deepest participation on my sector table for four straight weeks, 83% of its names above trend, and it won on price this week as well while Brent finished near $95 after the US and Iran resumed strikes and traffic through the Strait of Hormuz fell back to a handful of ships a day against dozens before the war, according to the PortWatch transit counts. Inside the sector the money is precise: refiners rank first of the hundred and nineteen industries I track over sixty days, with a relative-strength lead of 36 points on the S&P, because they earn the spread between crude that cannot leave the Gulf and products everyone still needs, while oilfield services, the group that sells the drilling, carries negative relative strength because producers, flush and disciplined, have not started spending. Materials holds second in participation at 66% and lost 1.4% in price, its gold miners and chemical companies pulling in opposite directions, a split I cannot explain this week. Financials is the third and last group above the line, at 59%, down from 72 in mid-August, and the rotation graph has it sliding out of the leading quadrant. The point the price does not show: energy's correlation with the S&P was 0.62 last year and reads -0.30 this year, so the sector that leads is also the one that pays when the rest of the book falls, which makes it a hedge, and hedges that everyone owns get crowded: in the latest session on my dark-pool page Suncor printed most of its volume off-exchange, with almost all of it flagged short.
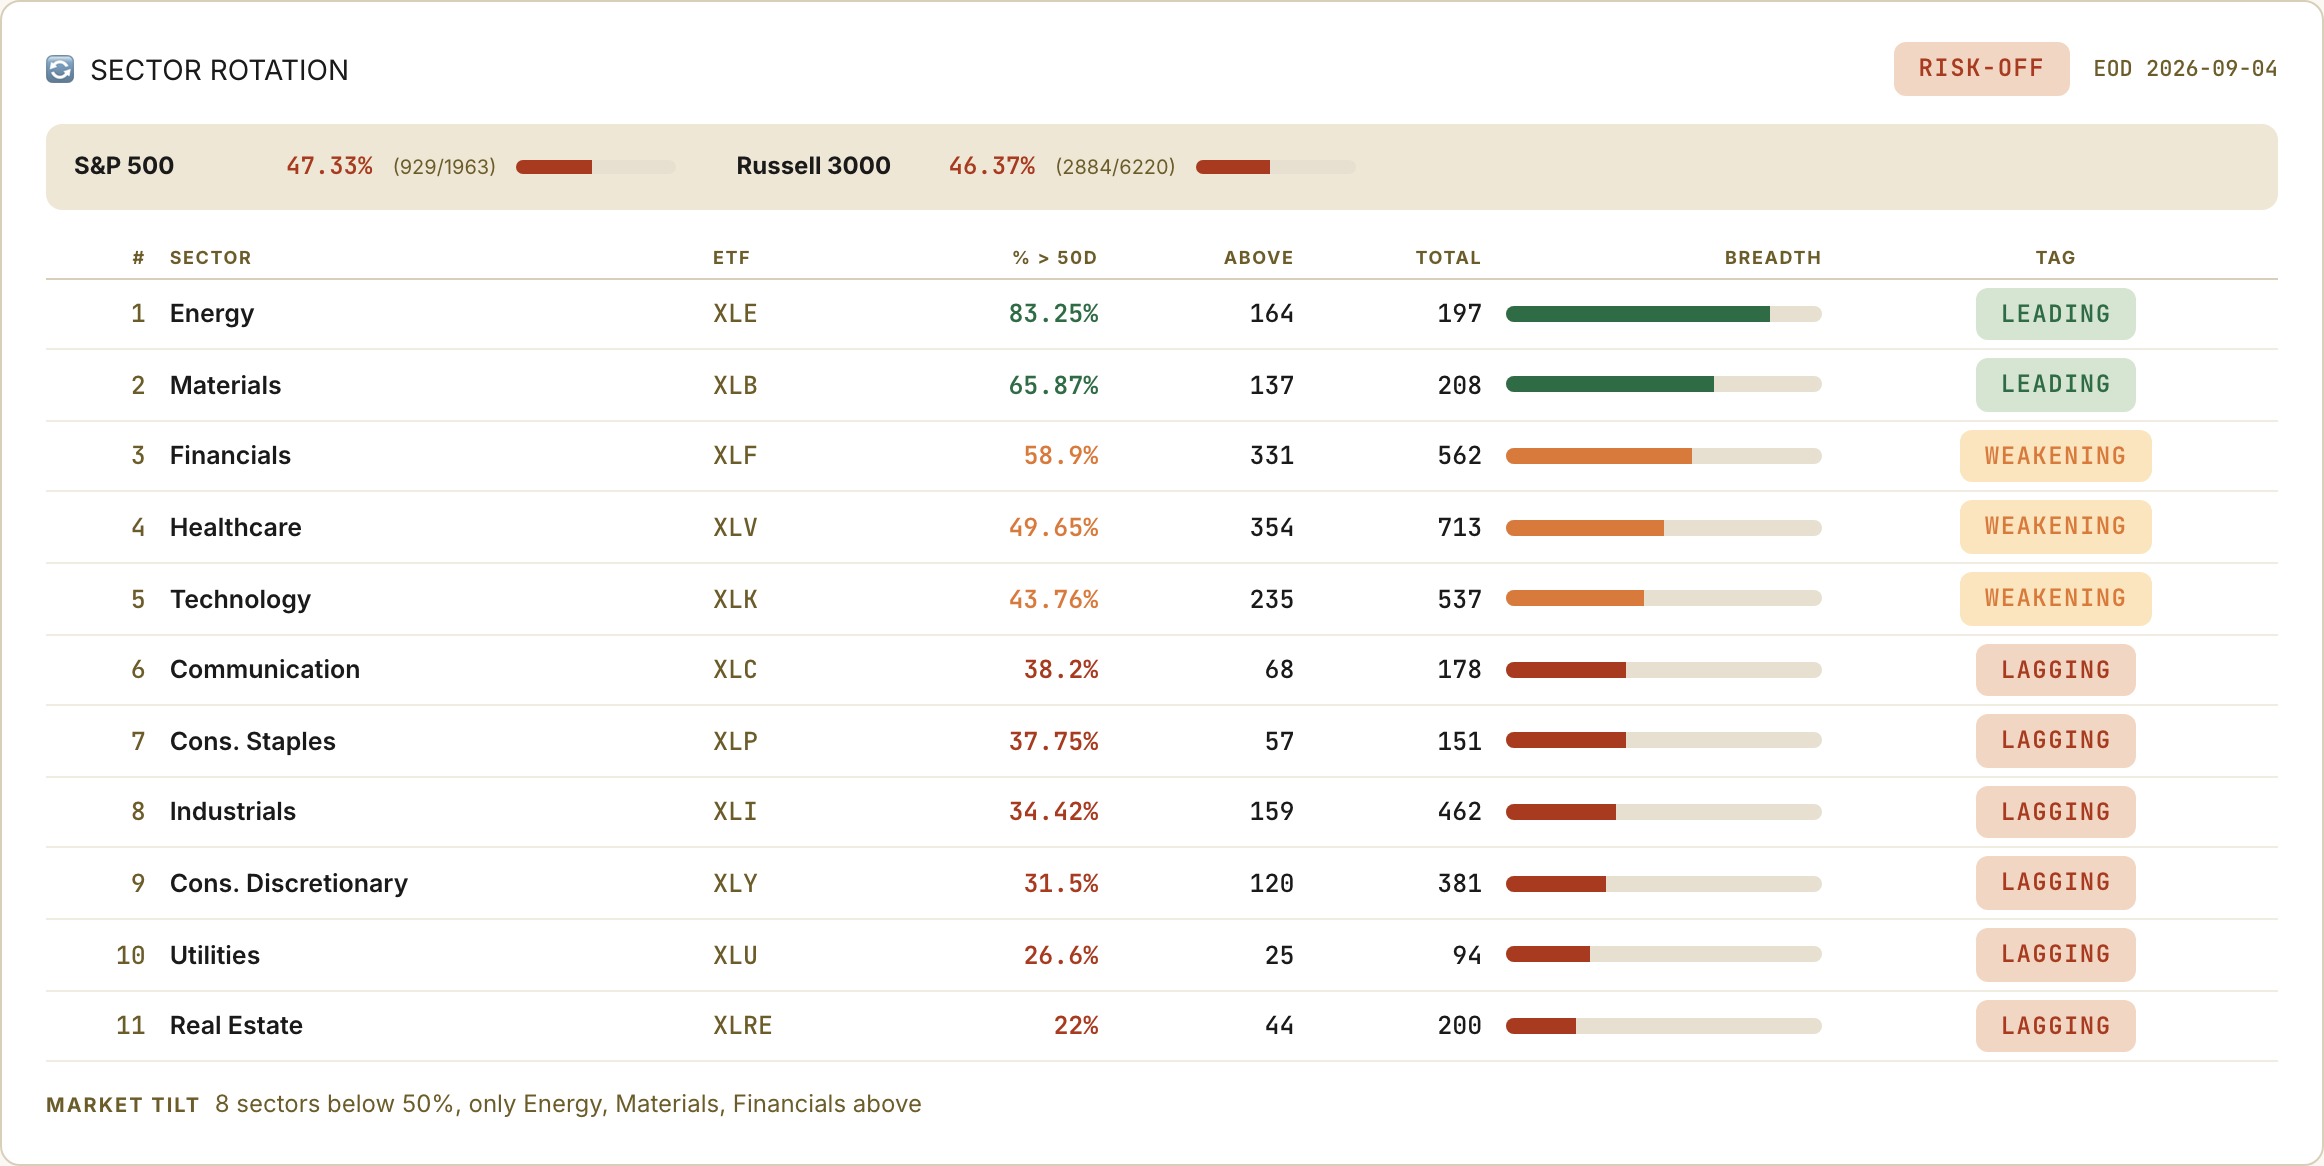
Below the line sit eight sectors, and they read like a list of what a higher short rate touches first. Consumer discretionary lost 2%, the worst line in price, with a third of its members above trend, and inside it the industries with zero names above the 50-day are resorts and casinos, airlines and trucking, while apparel manufacturing has 11%. Real estate is last in participation at 22%. Utilities sit directly above it at 27% after losing 2.8% in three weeks, which closes a thread from August: the group refused to rally in the two weeks when front-end yields fell, which should have helped it, and the front end has since reversed to a twenty-month high on the 2-year, so the refusal was the right read.
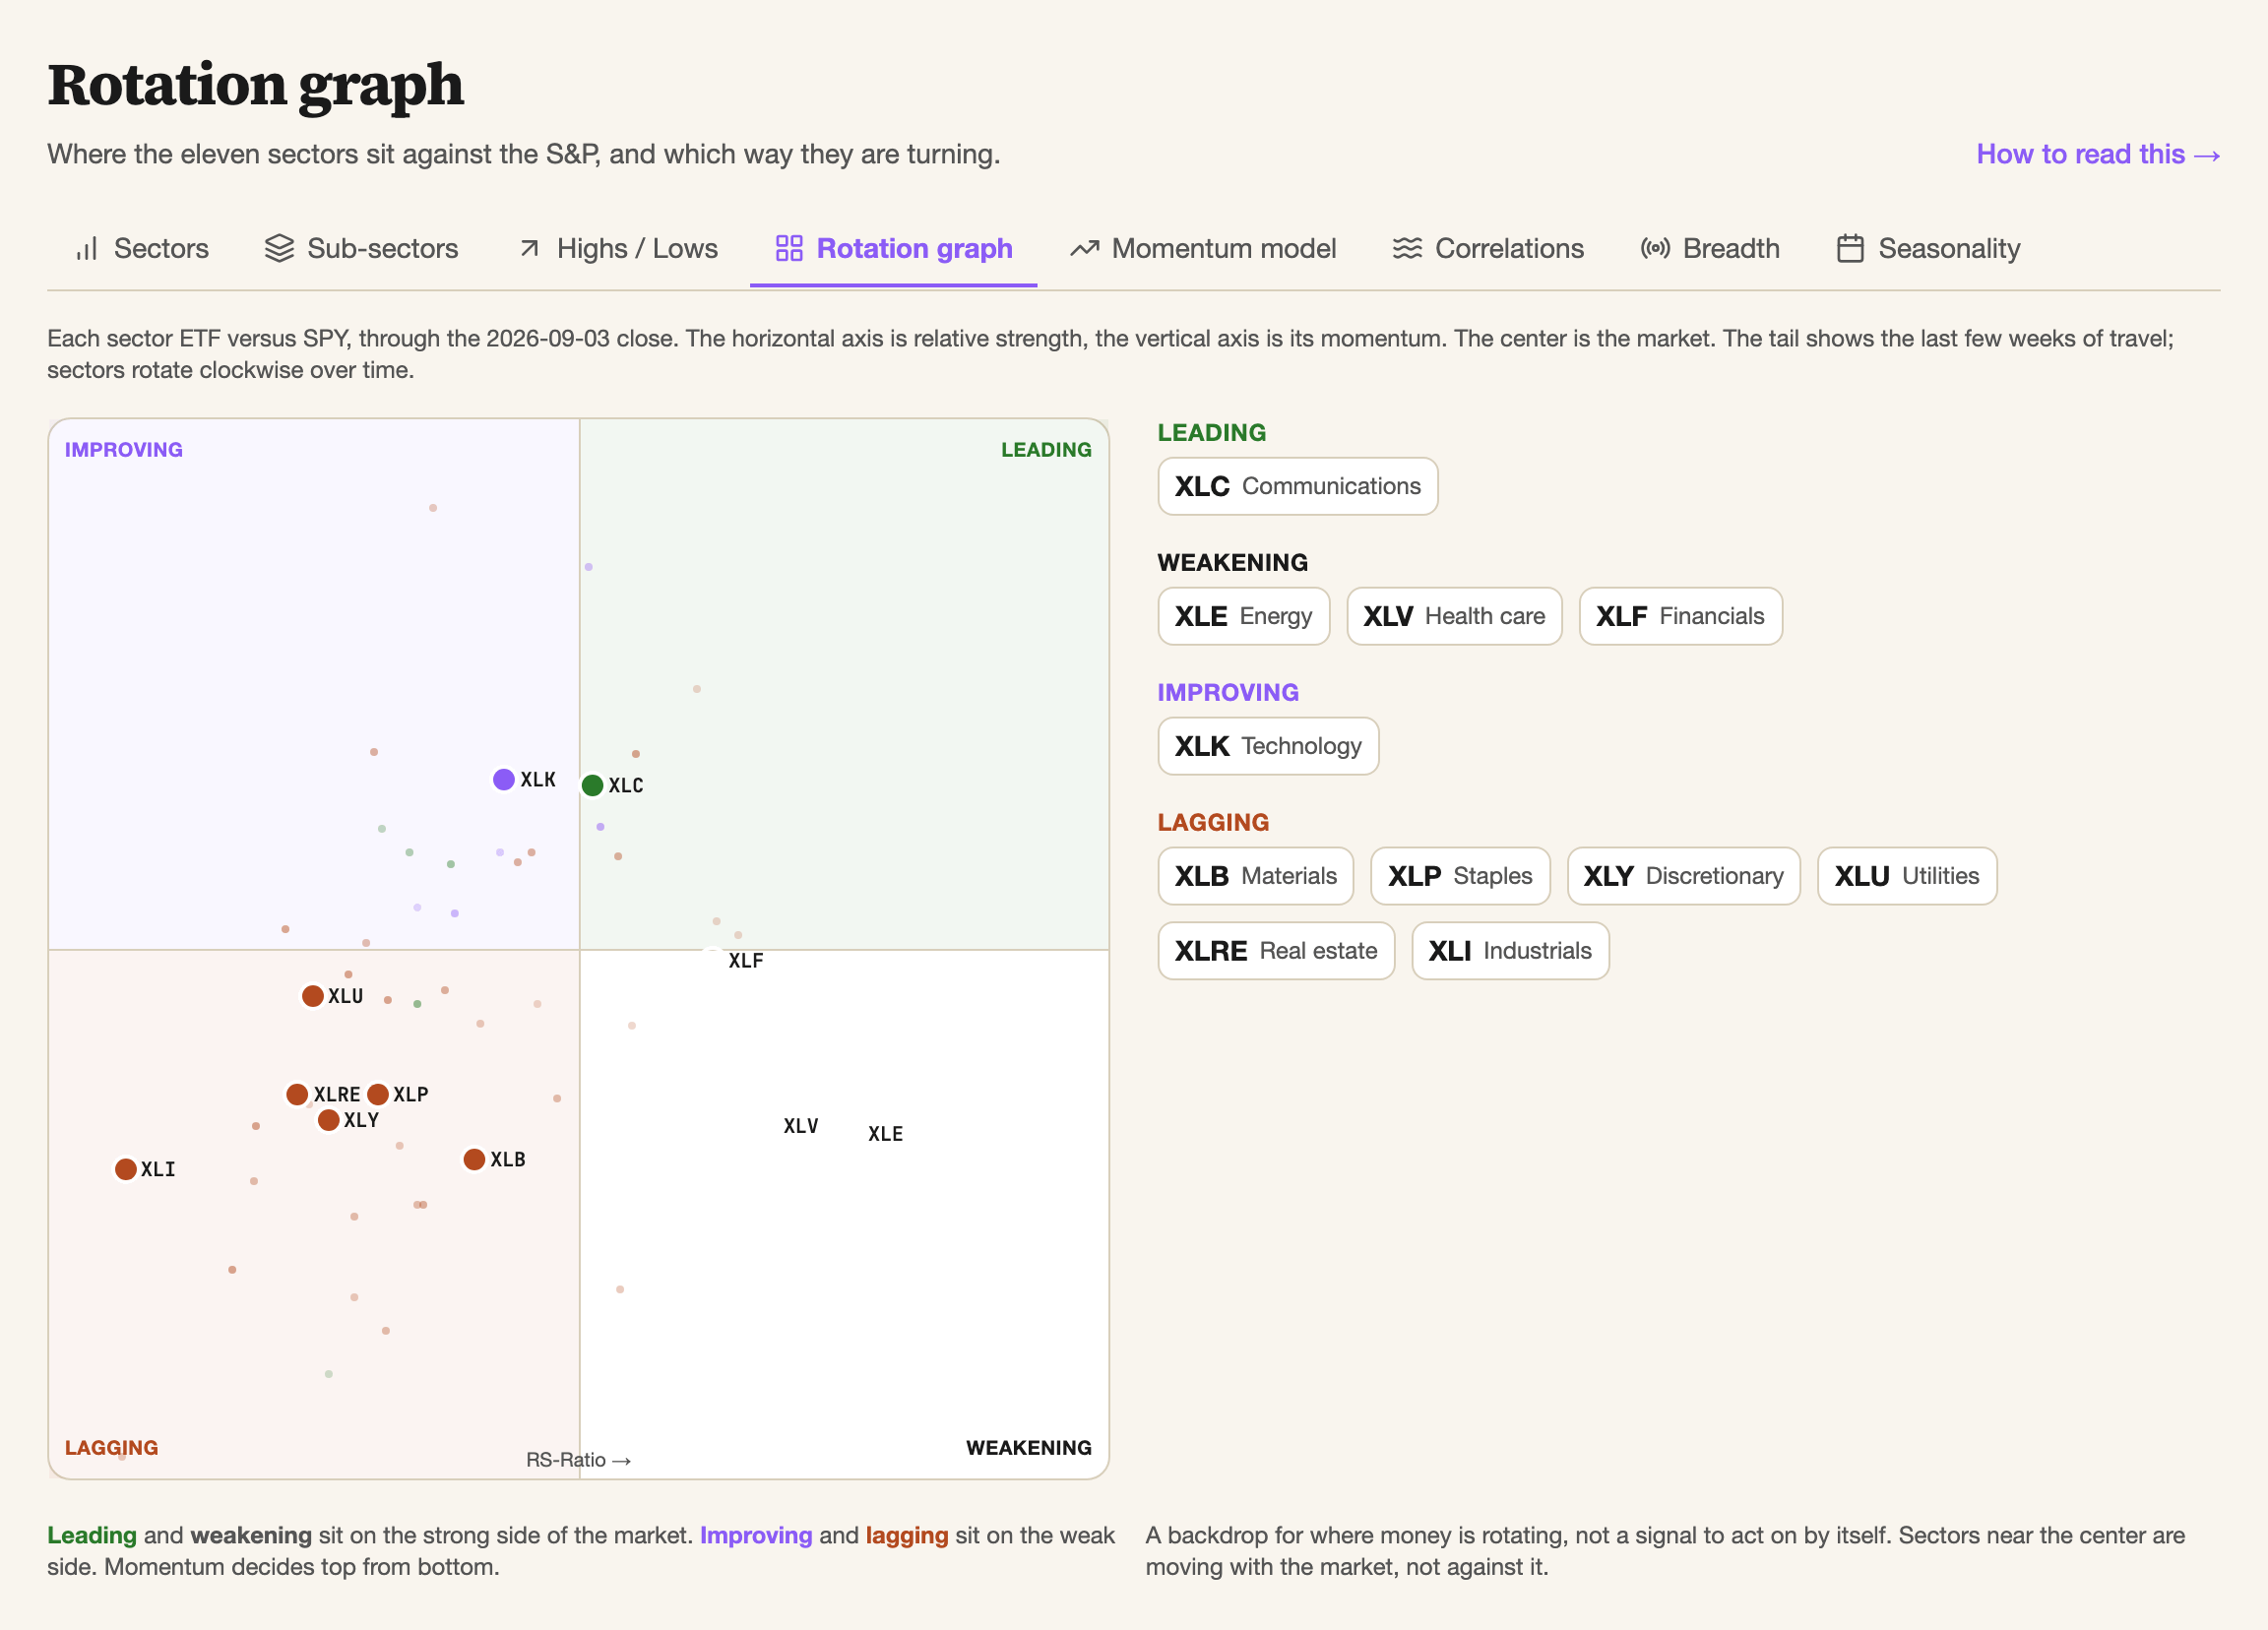
The rotation graph below adds the direction of travel the table cannot show: energy, health care and financials all sit on the strong side of the market with momentum fading, technology is the only sector improving and it still has under half of its members in uptrends, so the leadership that carried the summer is tiring and the one sector with enough weight to replace it has not arrived, which leaves the index with a handoff and no receiver into the most important two weeks of the quarter.
🔍 Pairs Alignment
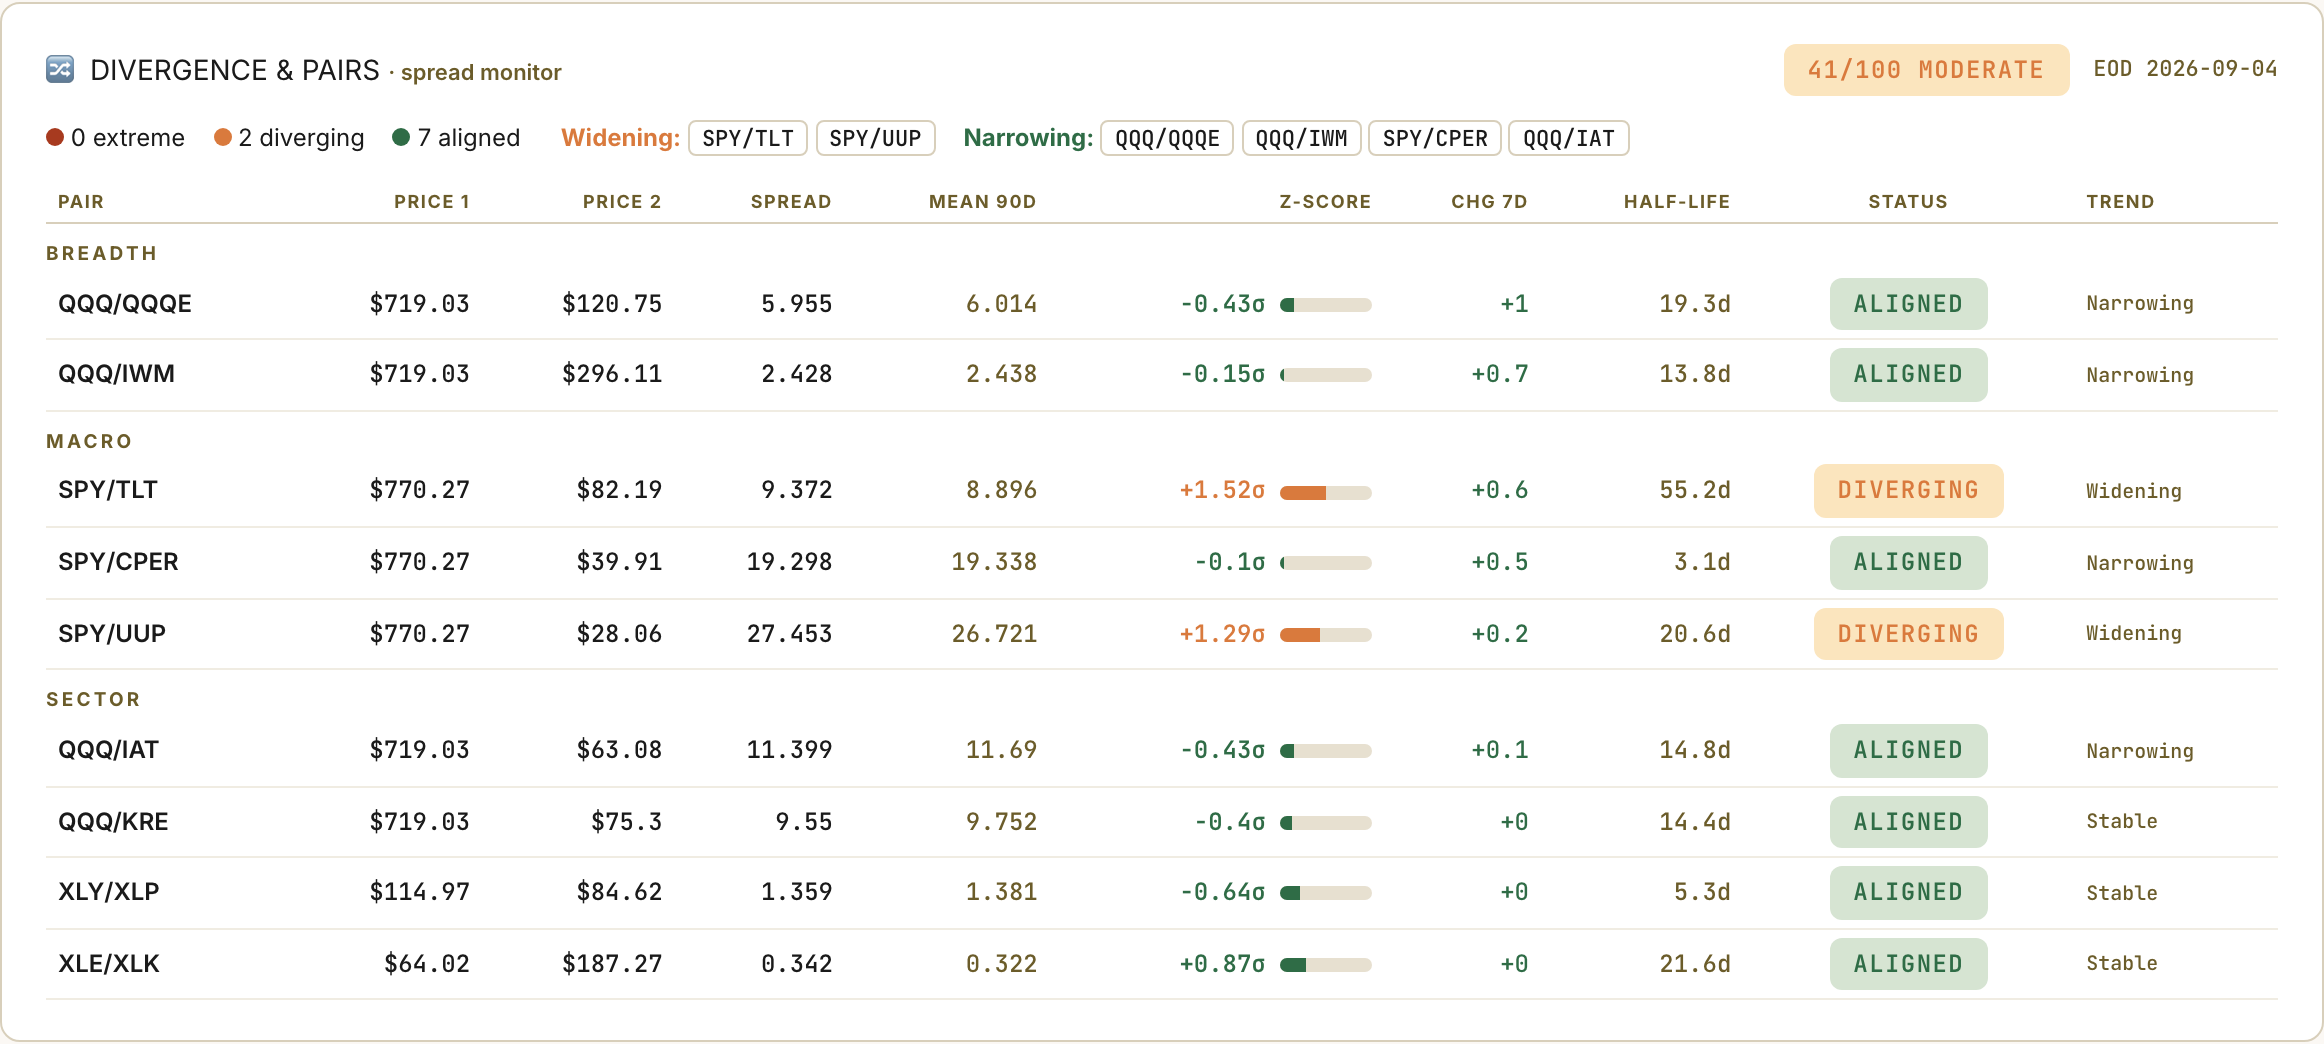
Nine spreads on my monitor, seven aligned, none extreme, and the two that are stretched both point at the bond market. The S&P against long Treasuries sits 1.5 standard deviations above its 90-day mean and the S&P against the dollar at 1.3, the signature of stocks holding while bonds and the dollar are sold, which is the risk-on pattern when breadth comes with it. It came without, so the two spreads describe two prices that cannot both be right, equities priced off earnings that have not been revised down and bonds priced off a hike that the futures market now puts at 58%. Inside technology the opposite rotation is running, because the Nasdaq-100 had been lagging its equal-weight twin and closed most of that gap this week, so the cap-weighted names are winning again inside tech while the equal-weight S&P loses to the index. Both moves are the same move seen from two ends: money is leaving the middle.
📉 Volatility
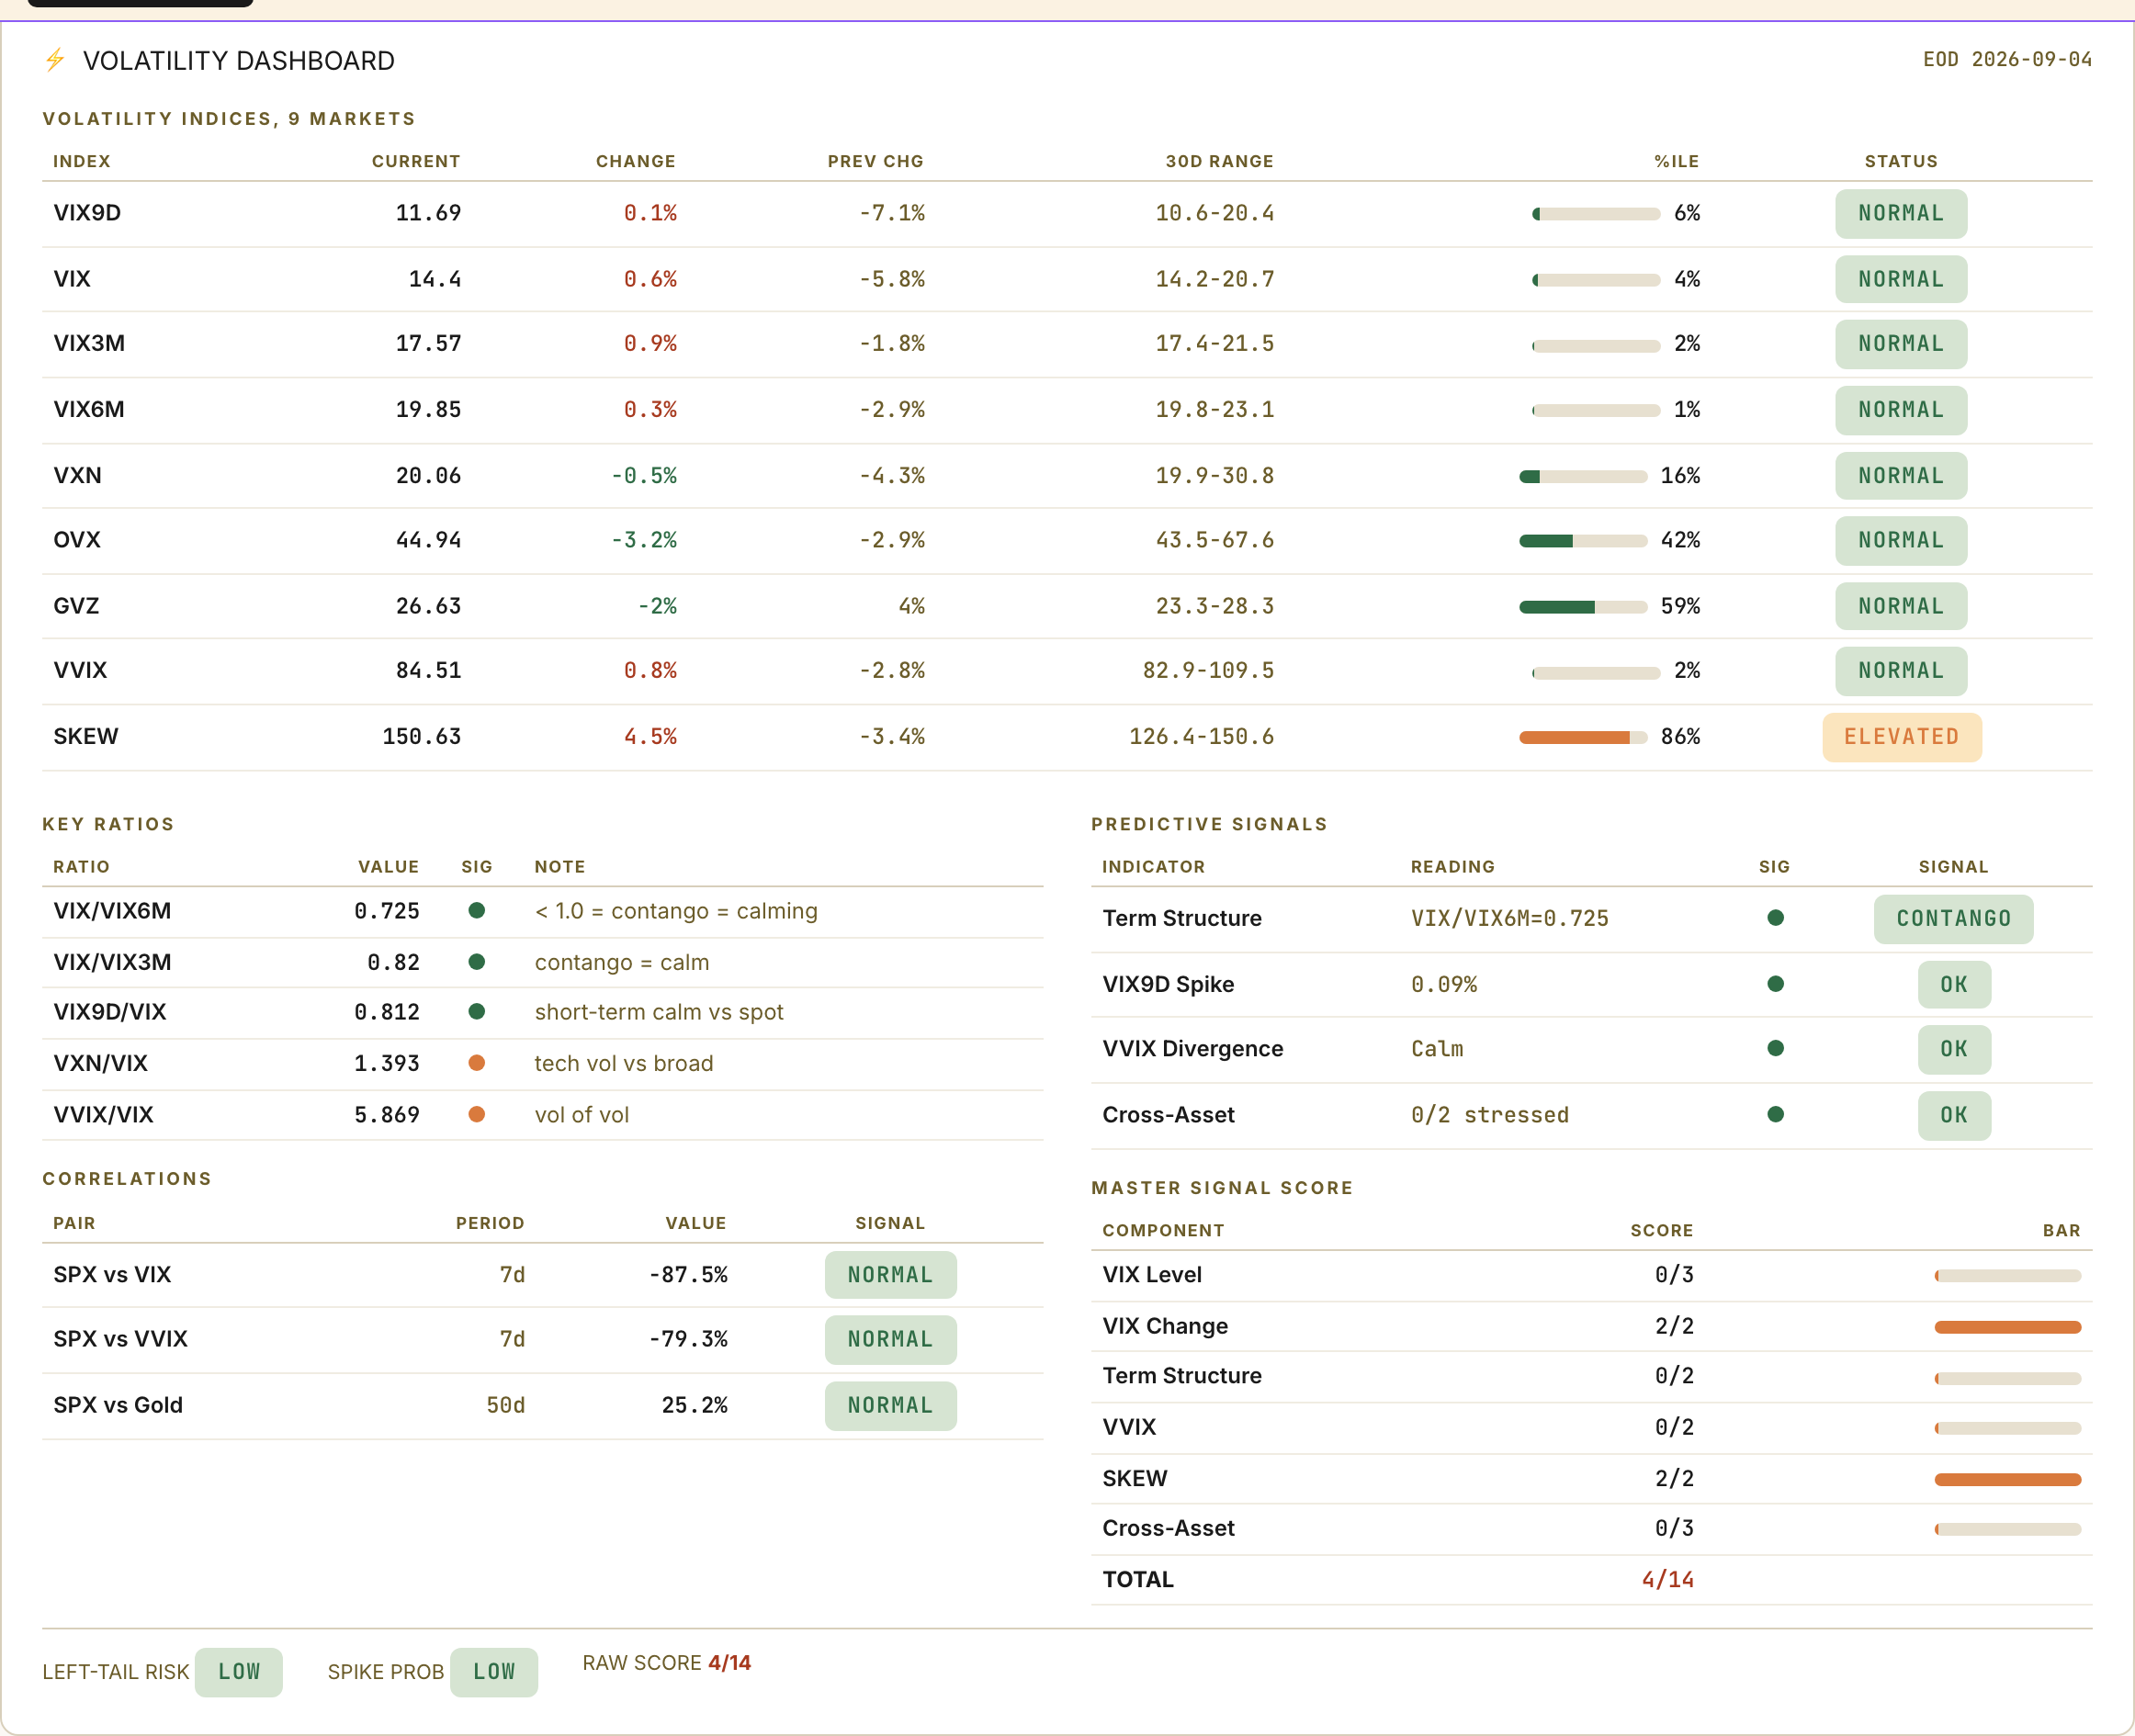
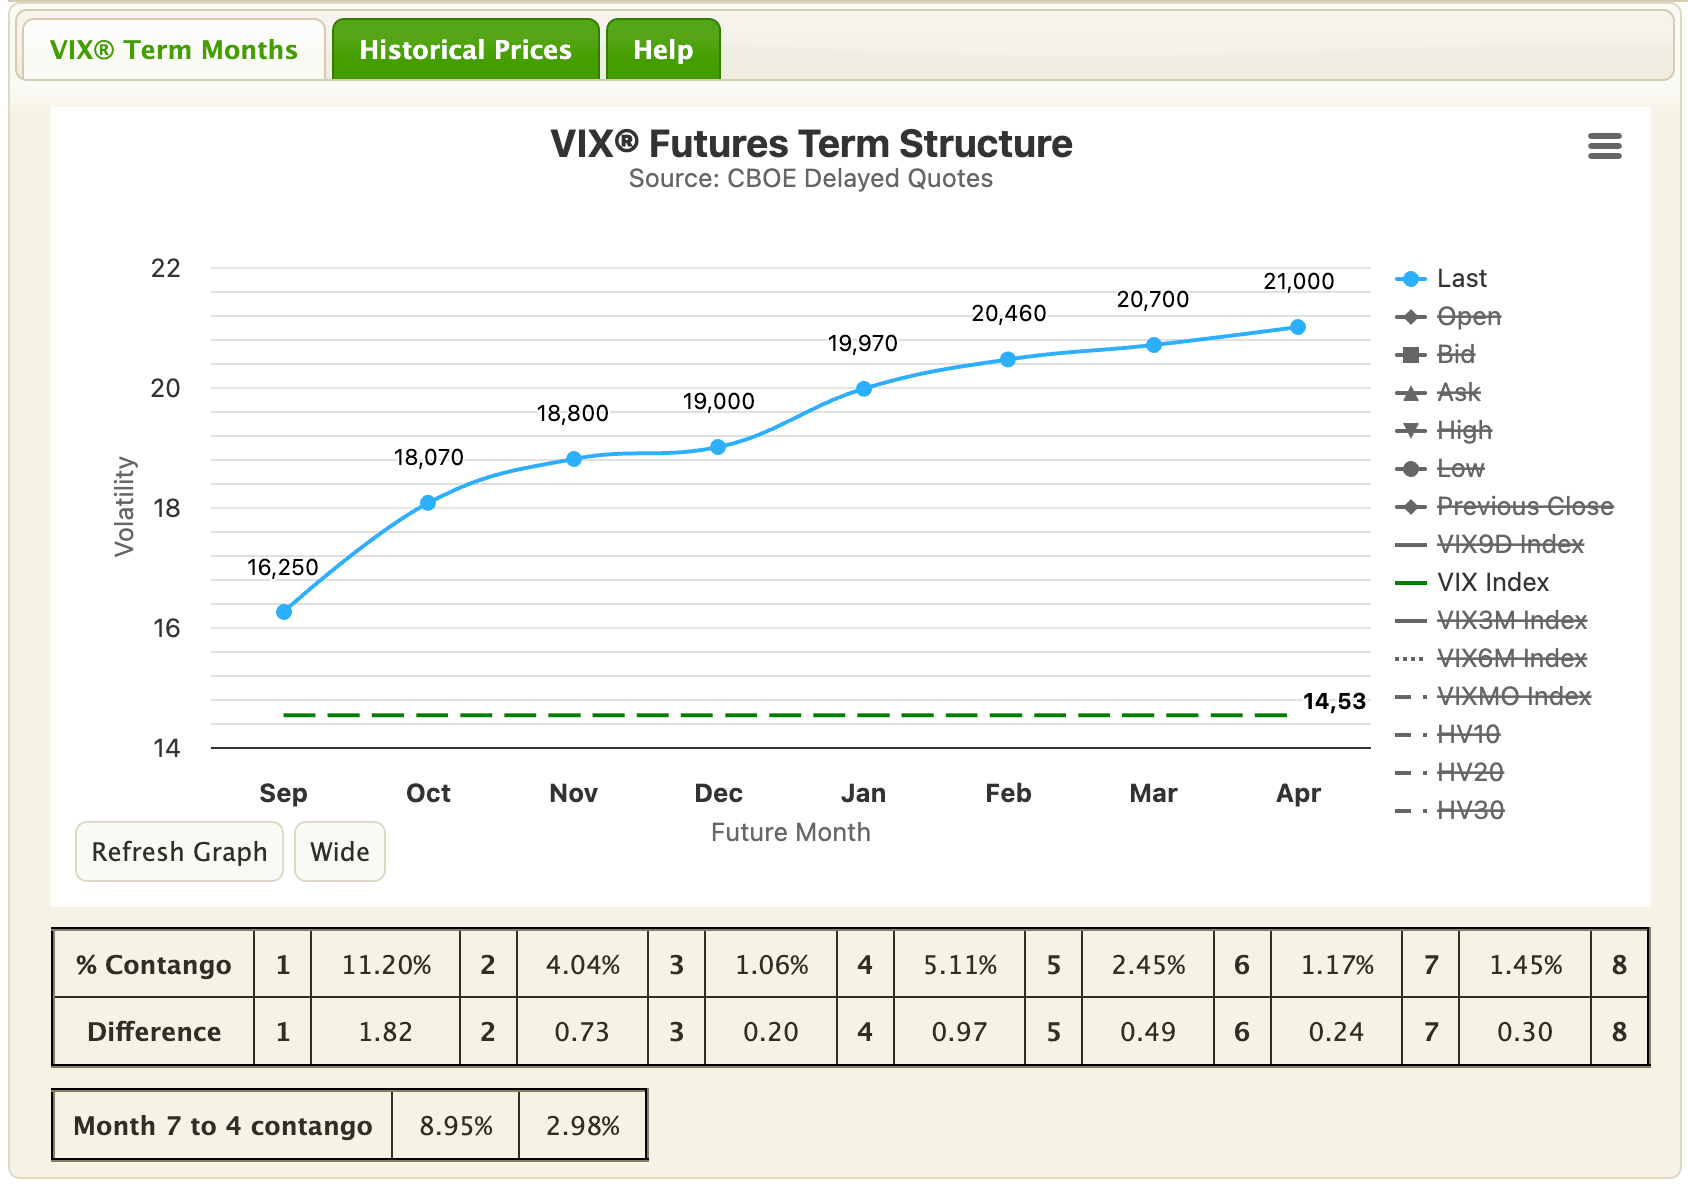
The VIX closed the week at 14.53, in the bottom tenth of its yearly range, while the SKEW printed 150.6 on Thursday, the latest reading and the top of its range for the month, and the two do not disagree by accident.
The SKEW prices far out-of-the-money puts against puts near the money, so when it rises while the VIX sleeps, someone is paying for protection against a large move while the market as a whole prices a small one. It has risen twelve points since mid-August, and the three-month-to-one-month ratio has come in from 1.30 to 1.21 as the front end woke up, so the autumn premium that looked expensive in August has been pulled forward into September. The three volatility signals I watch together, the SKEW, the term structure and realized volatility against implied, are all on at the same time this week, which is uncommon and which I read as a statement about positioning: a high SKEW says who is hedged, and it does not say when the hedge pays. Its use is sizing. This week calls for a smaller book than a 14 VIX would suggest.
💱 FX
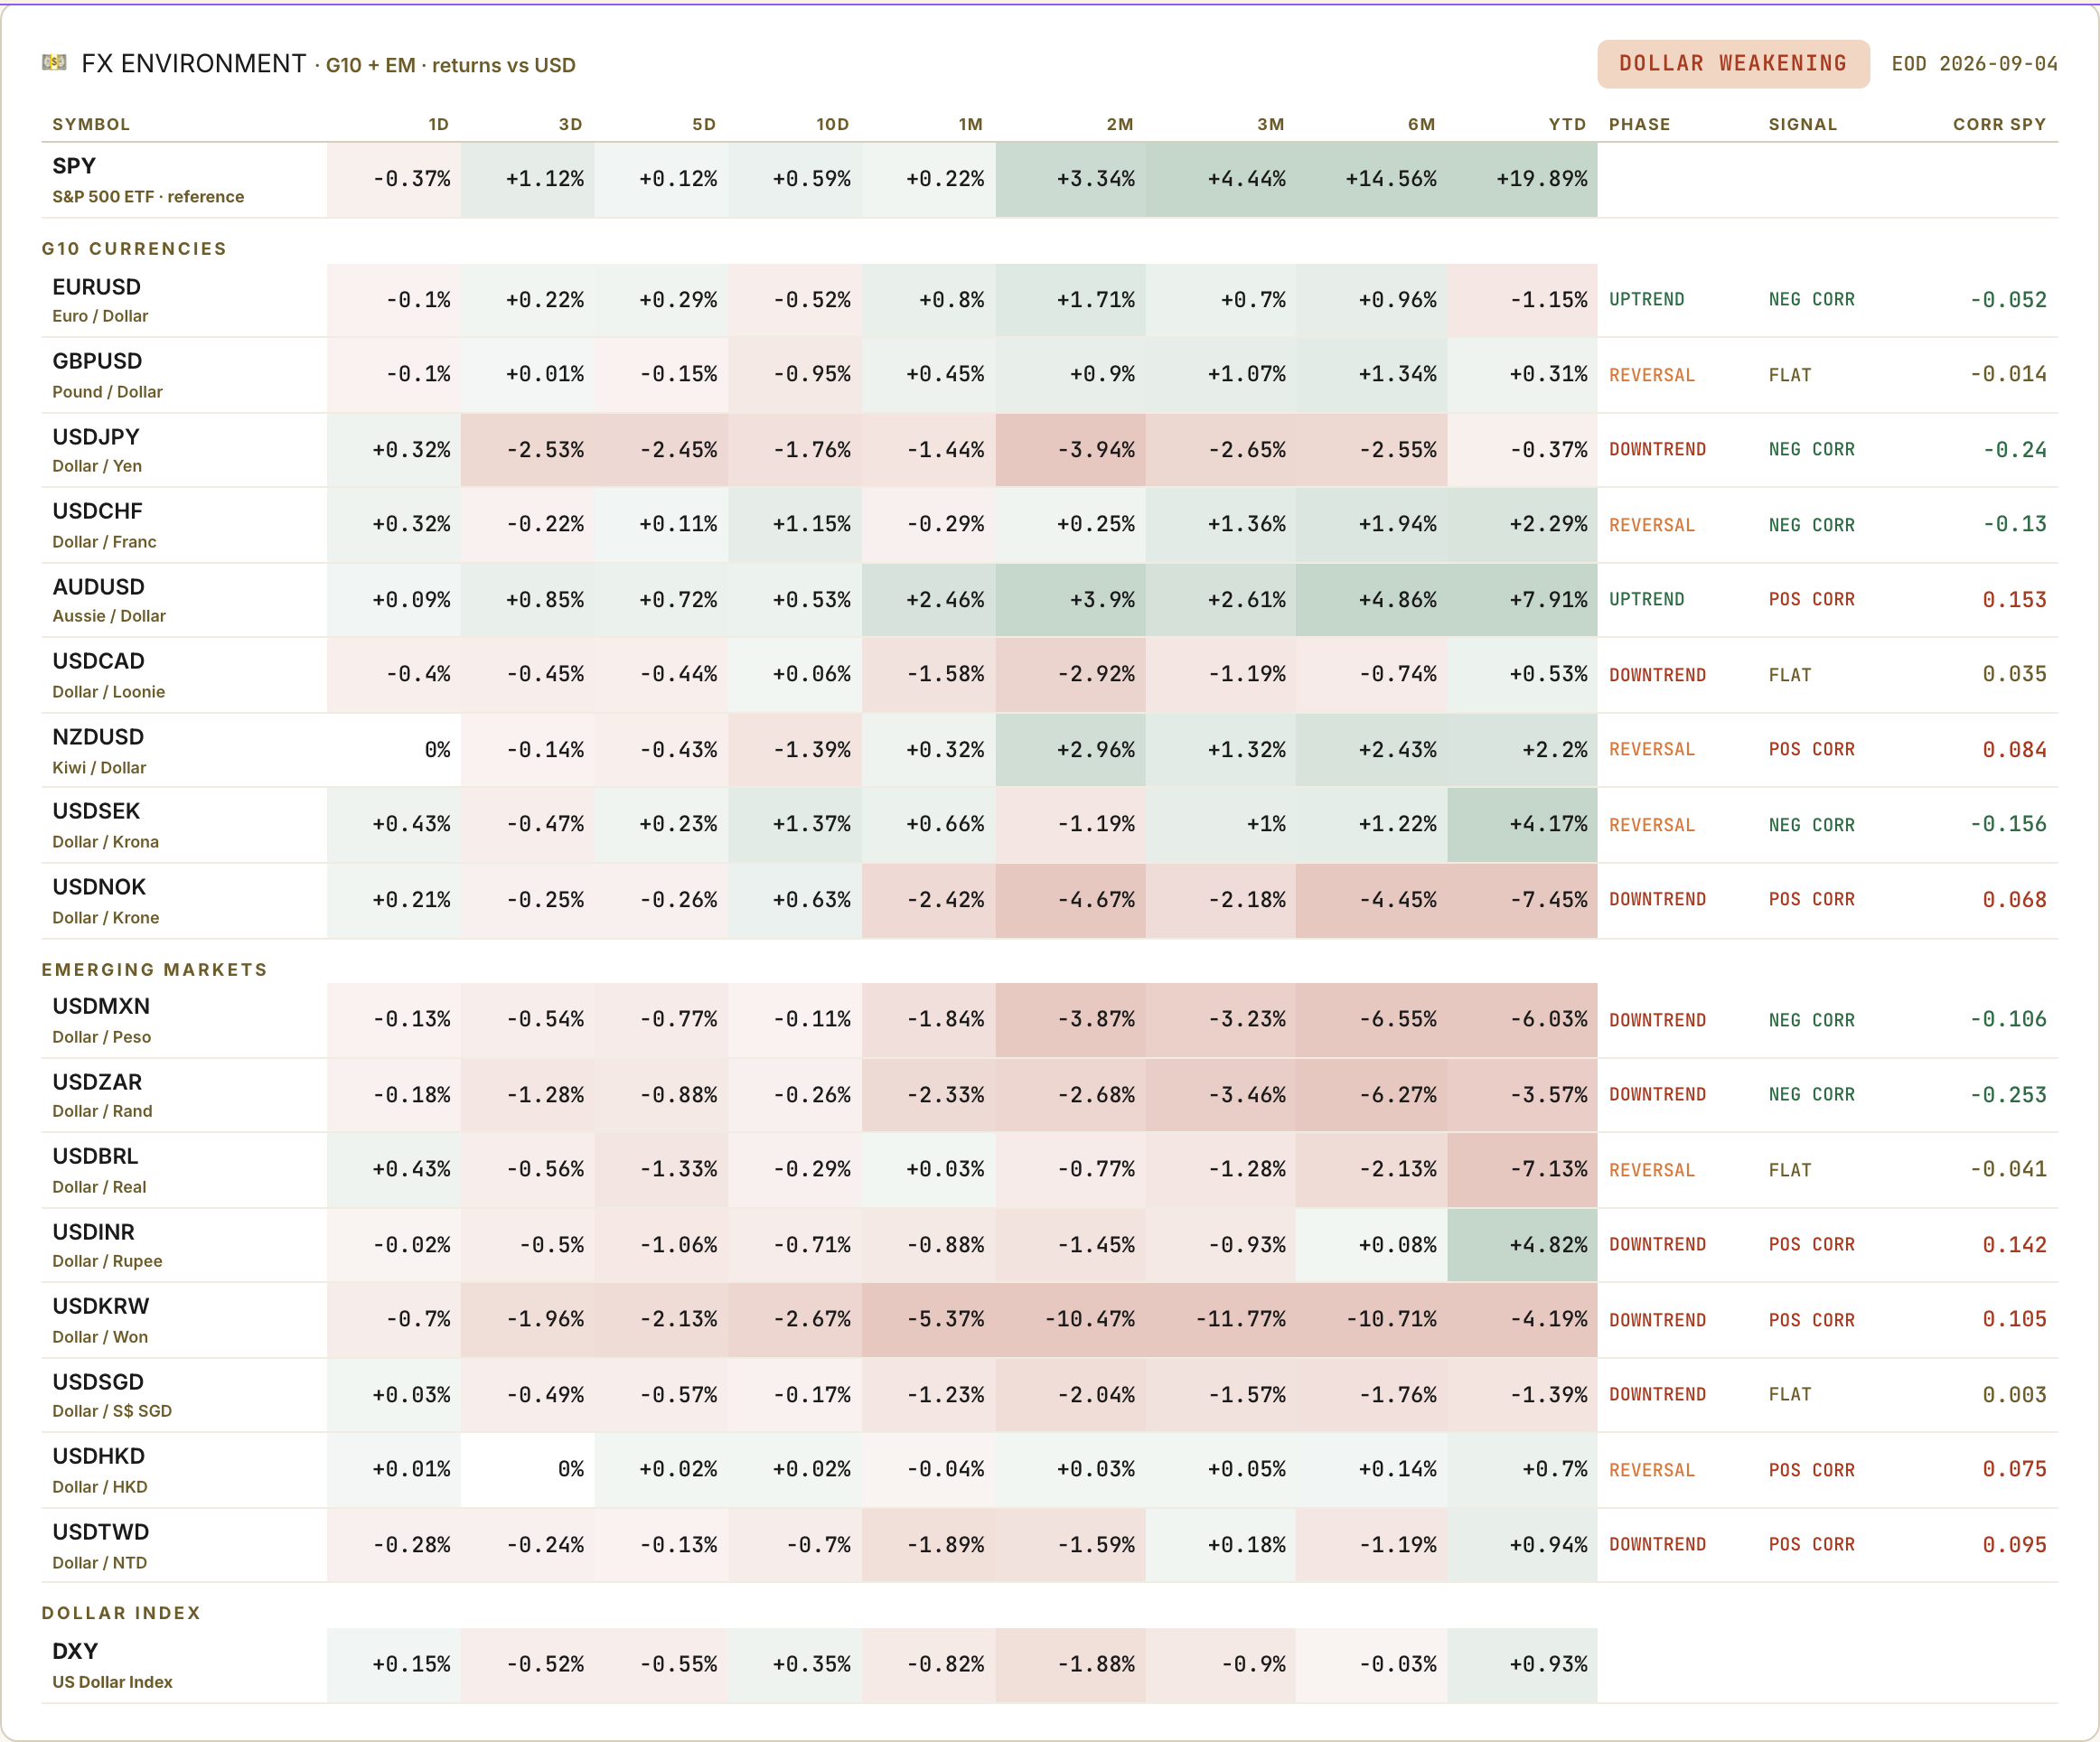
The yen made the week's biggest move and Washington did not have to buy it this time. The dollar index lost half a percent in a week when US 2-year yields hit a twenty-month high, the wrong direction for a currency whose central bank may hike in ten days, and the reason is one pair: dollar-yen fell 2.5% to 156, the yen's best week since the joint US-Japan intervention in late July, on a bet that the Bank of Japan turns hawkish at its September 17-18 meeting, the day after the Fed decides. Japan's top currency diplomat Atsushi Mimura said on Friday he remained alert and in constant contact with US authorities, the phrasing officials use when they want the market to do the work for them, and the market did it. So the two central banks that set the price of the carry trade meet in the same 48 hours, both leaning toward higher rates, with the funding currency already 2.5% more expensive; the template for a yen rally that meets a hawkish Bank of Japan is July 2024, when the unwind that followed took the S&P down more than 8% in three weeks, and while the positioning is smaller now and the Bank has already moved twice, I keep the date in mind. One more line from the same table: the Korean won, the currency most tied to the memory trade, strengthened 2% against the dollar in a week when the biggest hedges in the options market were bought on semiconductors. Those two facts may be unrelated. I would not bet on it.
🧠 My Take
Energy held and the broadening did not, because the 2-year went the wrong way for it. Everything now hangs on one number: CPI on Friday September 11, five days before the Fed decides.
Hike, priced and absorbed, 45%. CPI near consensus, a quarter-point hike on the 16th, and the 2-year stalls near 4.4% because the hike is already in it. The index holds between Tuesday’s low near 762 and the August record at 778, breadth stays weak, energy keeps leading. The tell: the 2-year falls on the day of the hike.
Hot CPI, disorderly, 30%. Core inflation above expectations, the market prices two hikes, the 30-year revisits 5.25%. A close below Tuesday’s low opens the way to 750, where the largest put position sits, and the VIX trades above 20 into the Fed meeting. The tell: the 2-year above 4.5% before the meeting.
Soft CPI, relief, 25%. Inflation cools, hike odds fall back under a coin flip, the yen rally reverses and the rally broadens the way I expected in August. The tell: the equal-weight S&P beats the cap-weight index five sessions running.
🔥 Trade of the Week:
Dick's Sporting Goods closed Friday at $139.15, down 31% since mid-August, almost all of it on one day. On August 25 the company missed its quarter and cut its full-year earnings guide to $11 to $12 a share from a range that started at $13.50, and the stock fell 31% on twenty-eight times its normal volume. The problem is Foot Locker, the chain Dick's bought a year ago, where comparable sales fell 3.6%. Dick's own stores grew comparable sales 4.9% in the same quarter. So the market sold the whole company for a problem in one part of it, and that is what I am buying: a core business that is still growing, priced at 12 times the cut guidance, with a 3.6% dividend and a mean analyst target of $166.
My Bottom screener, built to catch declines that have run their course, has had Dick's on its list all week, and Dick's directors bought. Four of them put $3.7 million into the stock in the two days after the fall, Mark Barrenechea alone $2.2 million. Directors buying with their own money two days after cutting guidance, at the low, is the pattern I weight most heavily.
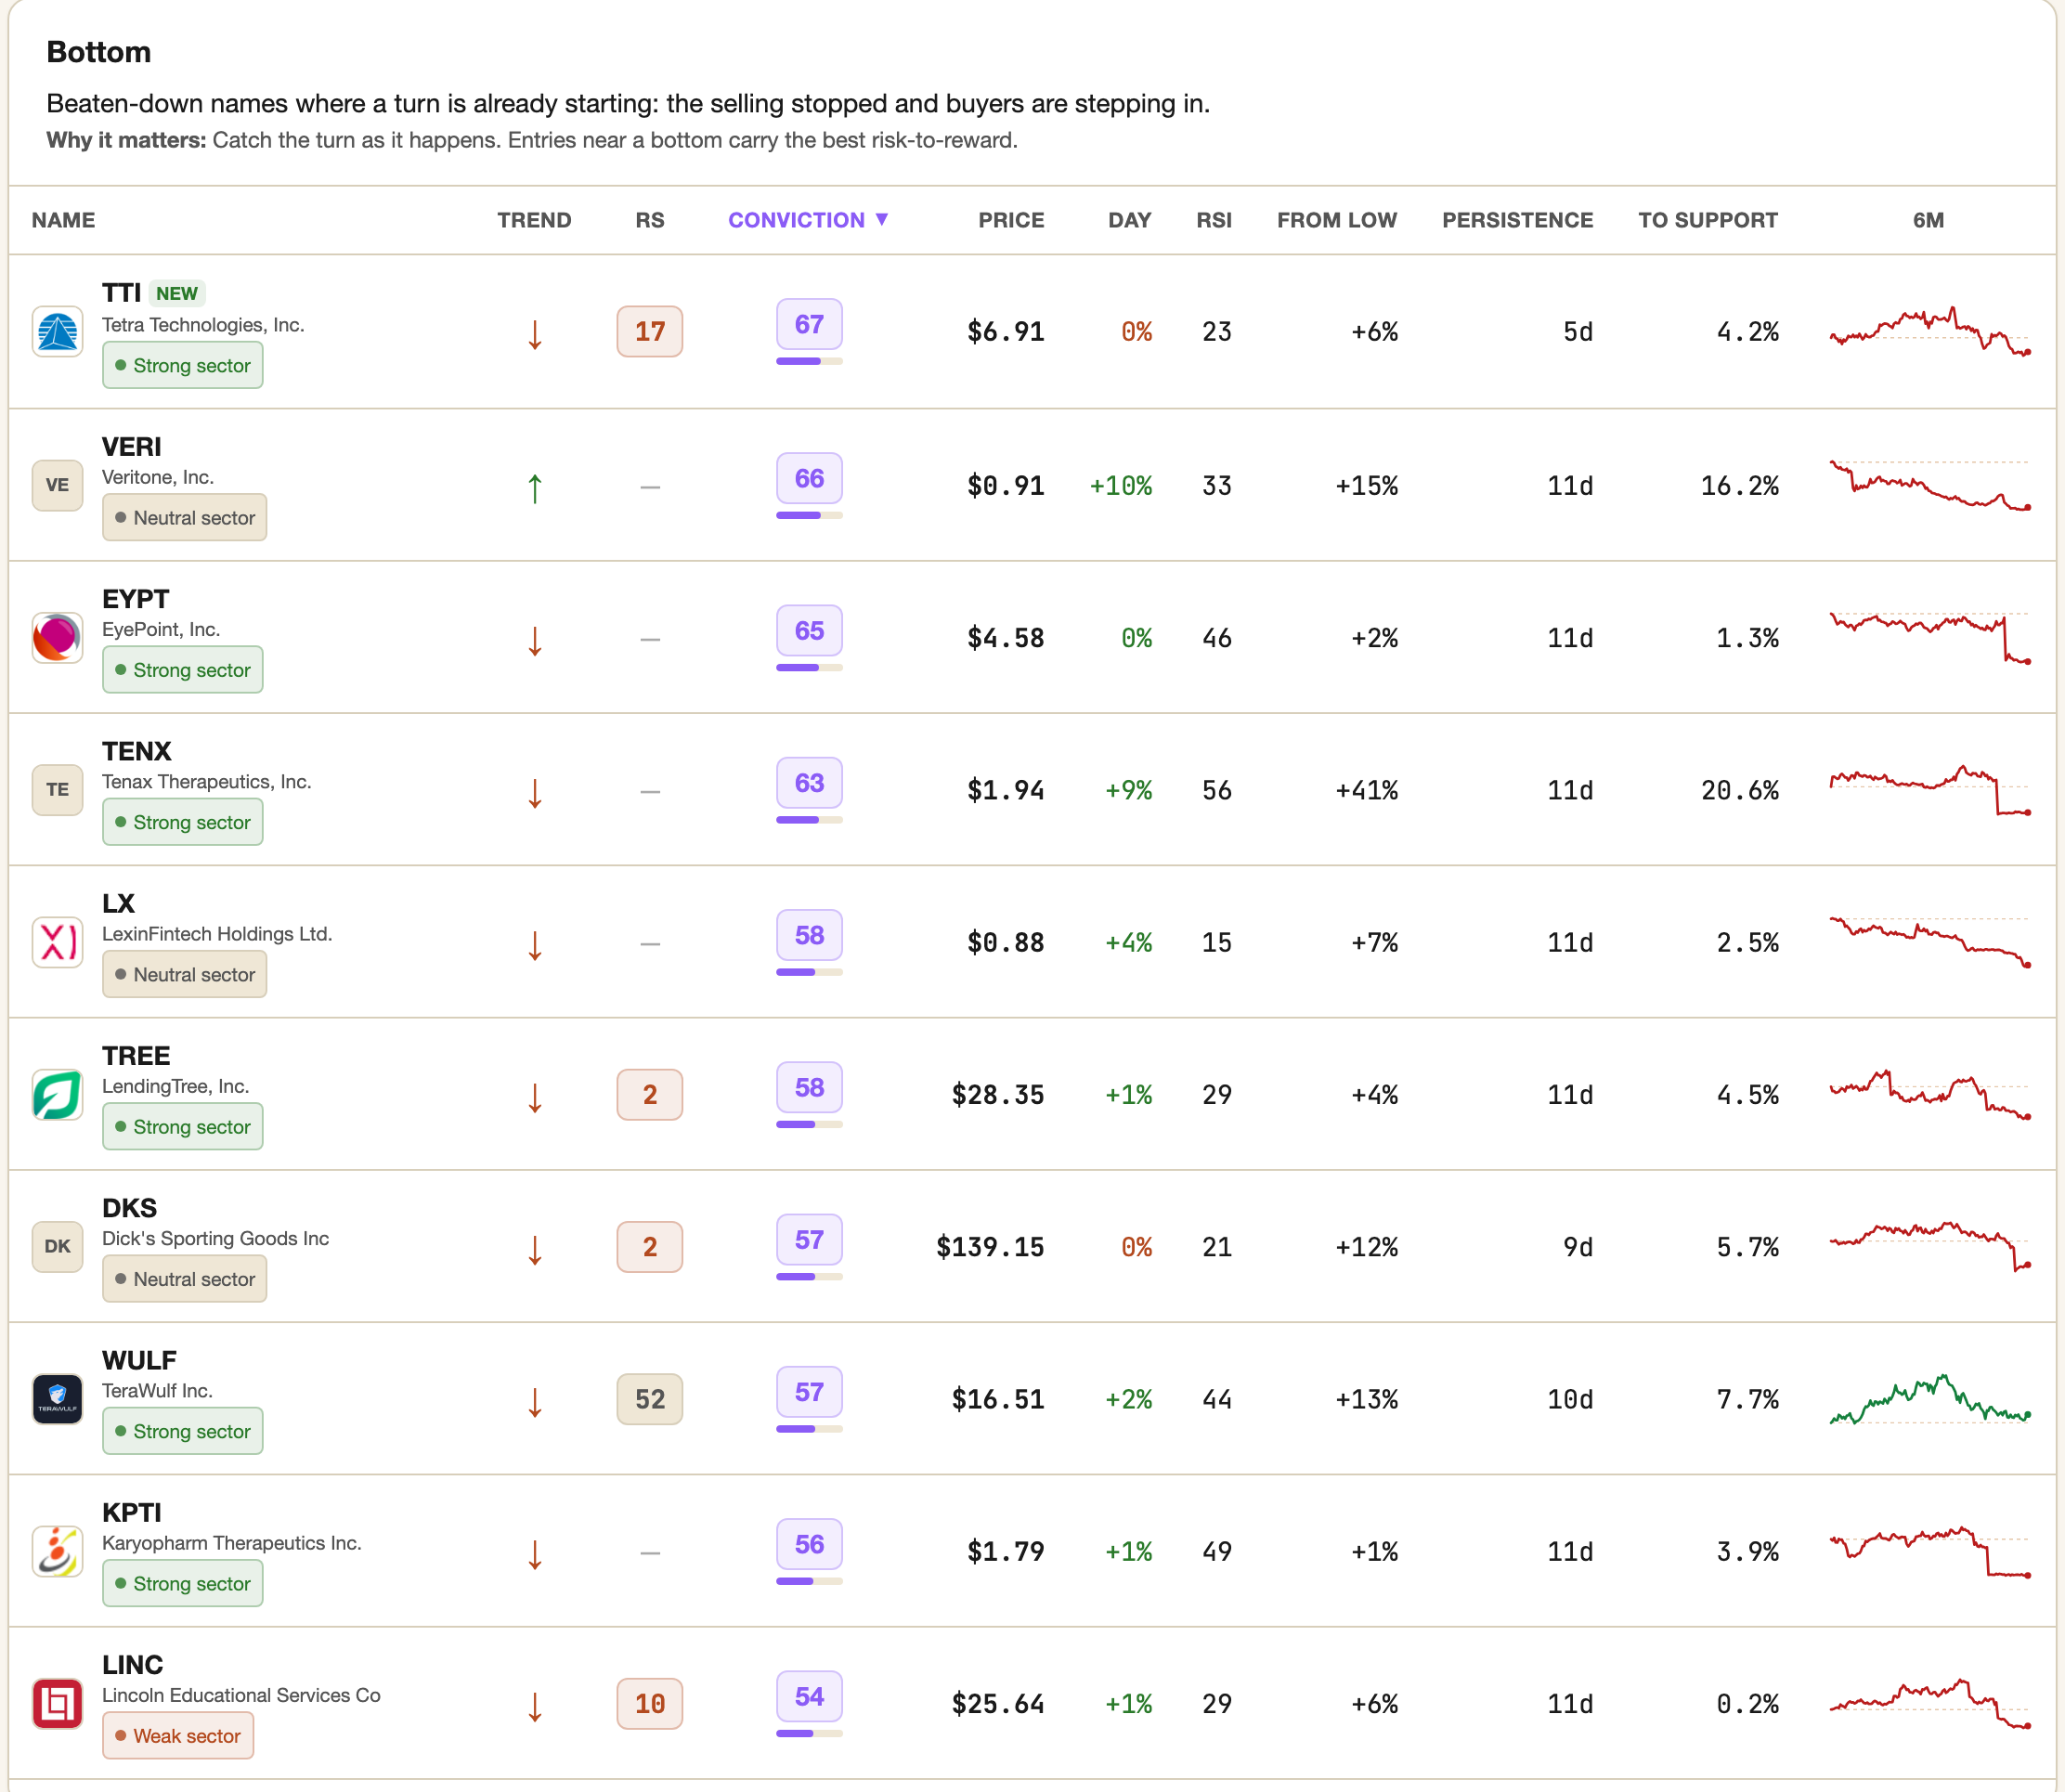
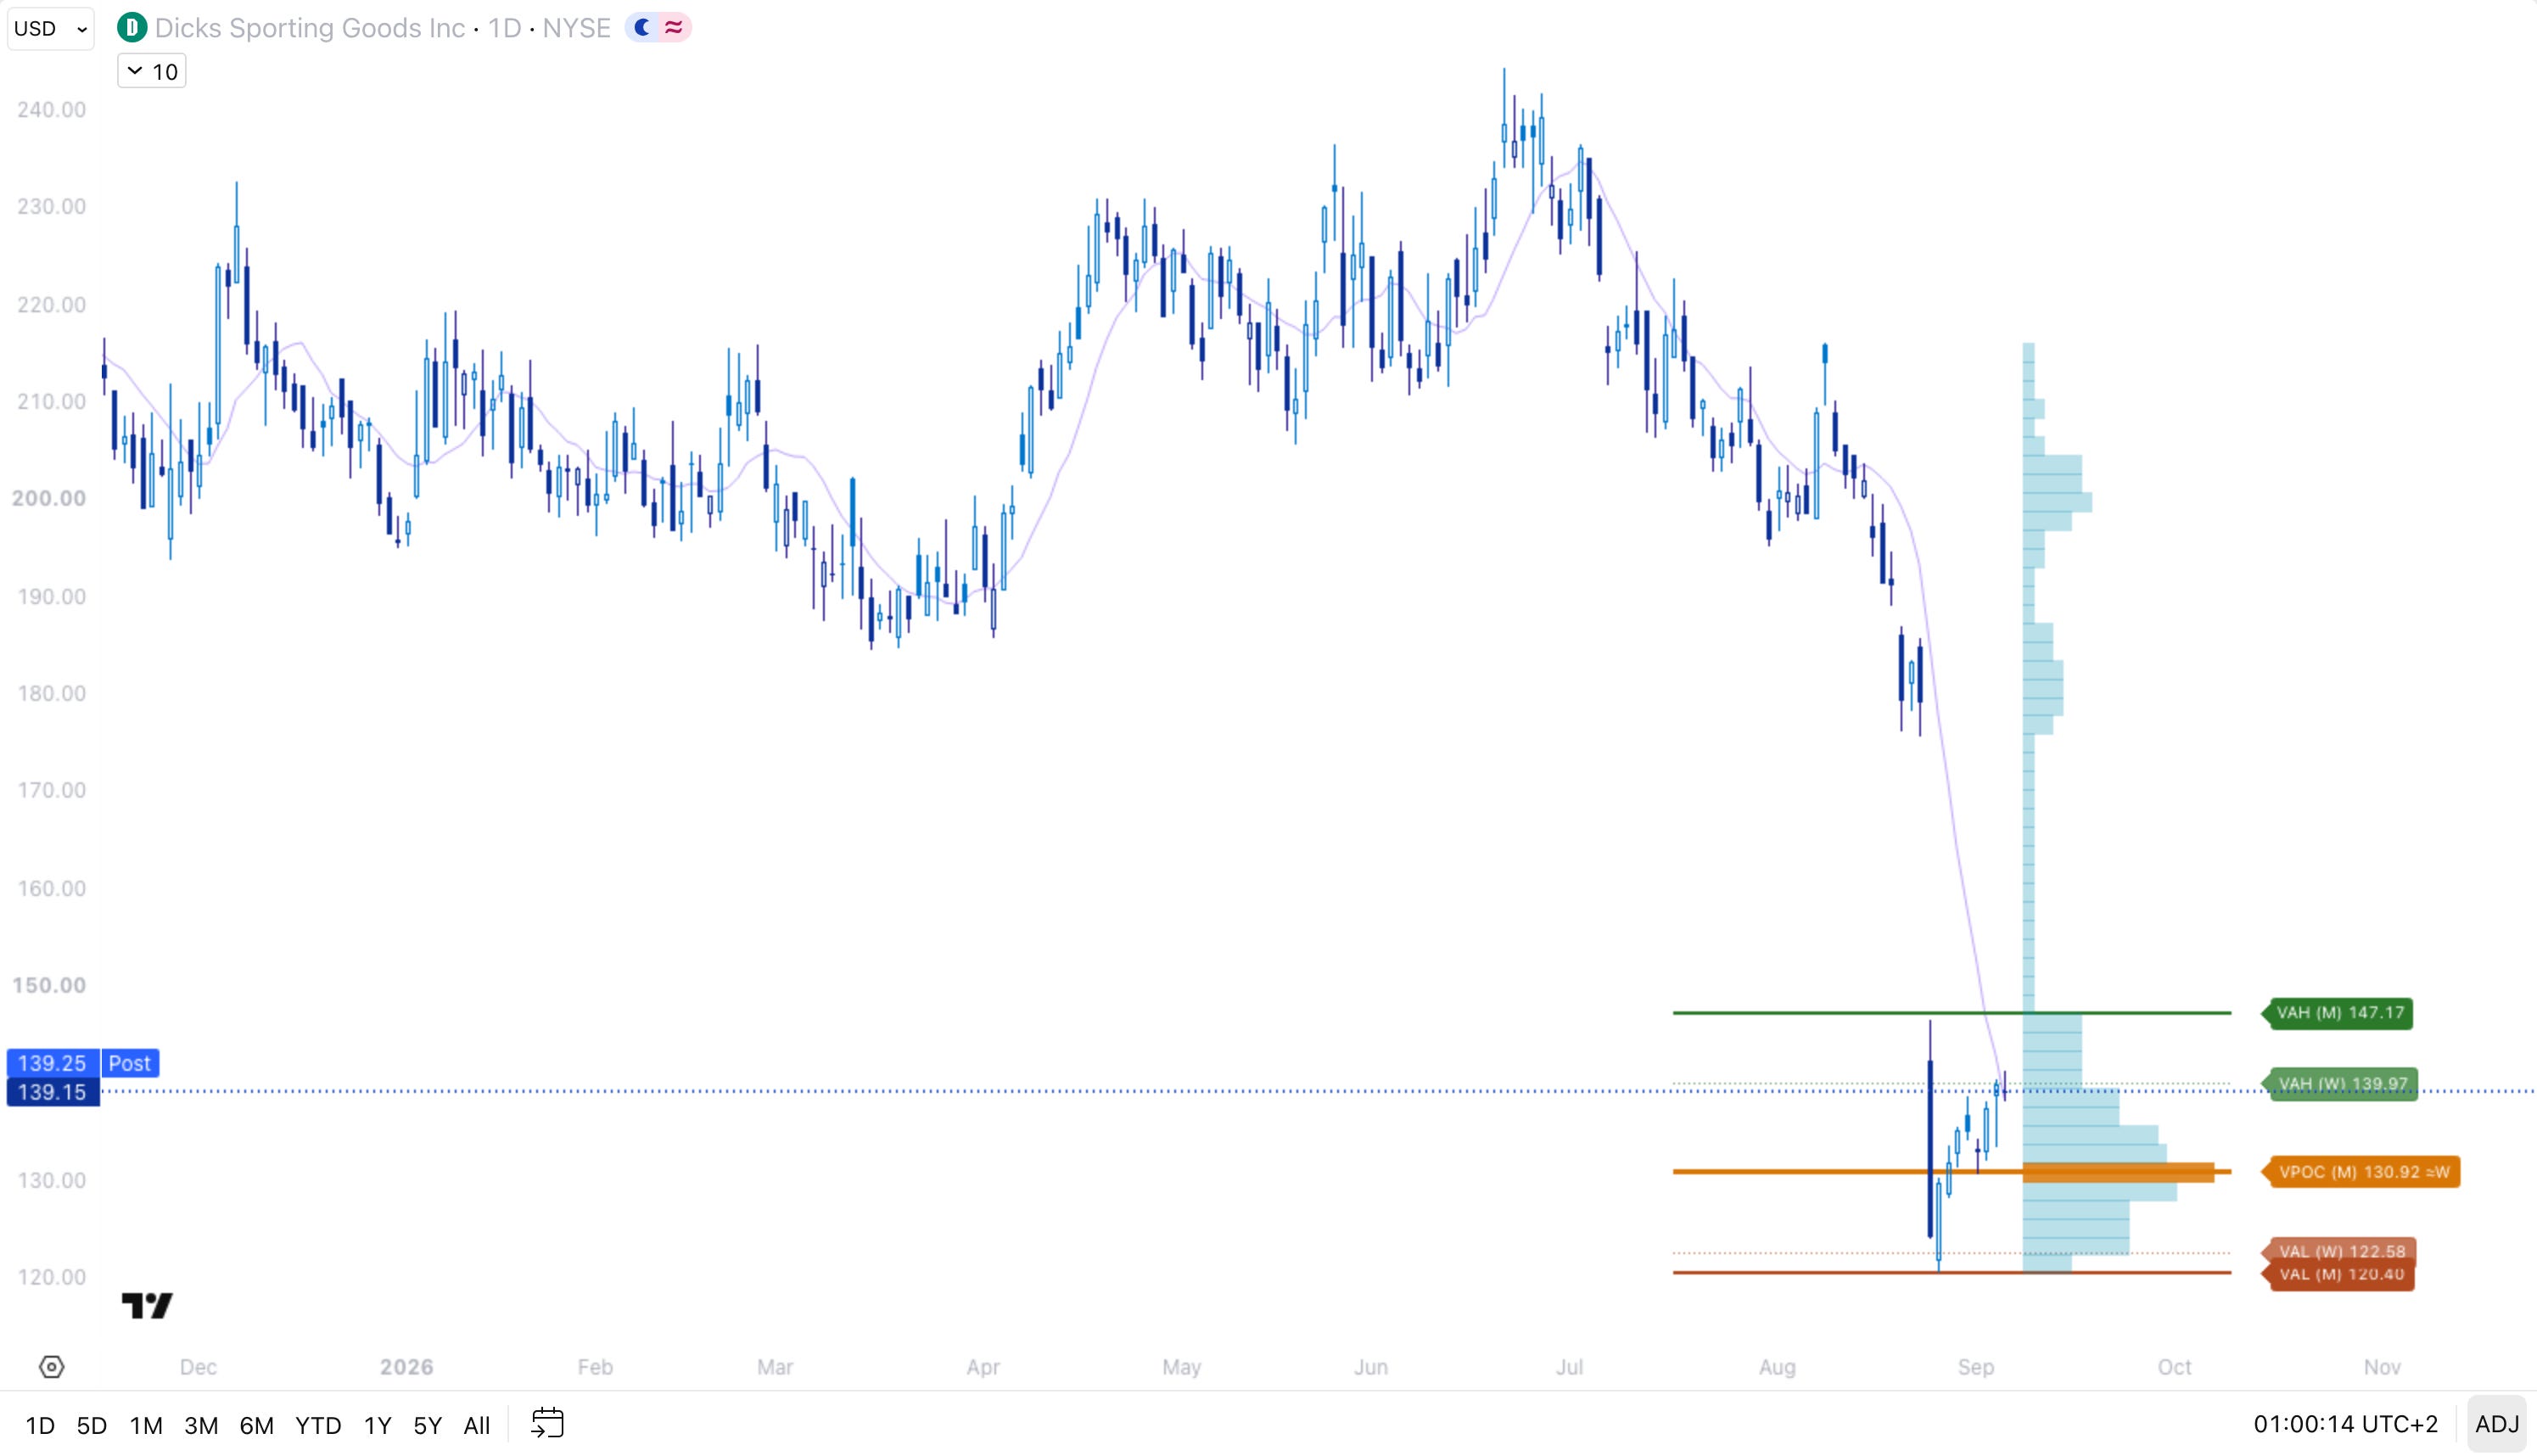
The chart (with volume profile) shows where the stock has traded since the crash. Most of the volume since August 25 changed hands between 122.58 and 139.97, with the busiest price at 130.92, which is also where the directors bought. Friday's close sits at the top of that range, so the stock is now asking whether buyers will pay more. Above, 147.17 is the first level where people who bought on the crash day get their money back, and that is the first target. Below, 131 is the price I want for the second half. A close below the August 26 low at 120.40 means the bottom is not in, and I am out.
- Sizing: small, half the usual, in two halves
- Entry: $136.00 first half, $131.00 second half
- Stop: $119.90
- Target 1: $147
- Target 2: $166
- Stretch: $175
See you next week,
Daniel
P.S. The app is the daily version of what you just read, the same boards and screeners I run every morning before I trade. It now comes with a free 7-day trial.
Disclaimer
This newsletter is for educational and informational purposes only. It is not financial advice.
The content reflects personal opinions shared publicly as a journal. Trading stocks, options, futures, or any financial instrument involves significant risk. You can lose your entire investment. There is no guarantee of profit.
The author is not a registered investment advisor, broker, or financial professional with any regulatory authority including the SEC or CFTC. Always consult a licensed financial advisor before making any investment decisions.
By reading this newsletter, you accept full responsibility for your own trading and investment choices. Past performance does not guarantee future results. Markets are unpredictable.
Screenshots are courtesy of TradingView, VixCentral, and other platforms with which the author has no affiliation. Information shared may contain errors or become outdated quickly.
This content is the intellectual property of the author. Copying or redistributing without permission is prohibited.
By continuing to read, you acknowledge and accept these terms.
Read the desk every week
Market analysis in plain English, plus the app that scans the whole US market for you.
Become a member Read the original on Substack ↗