The Index Is Fine. 70% of Its Stocks Are Not.
Market Recap · September 20th 2026 · The Philosopher Investor
2026-09-20 · 15 min read · Originally published on Substack ↗

Hello my friends,
On Wednesday the Fed raised rates for the first time since 2023, 25 basis points to 3.75 to 4.00%, on a 12 to 0 vote. Kevin Warsh said inflation had been too high for too long, and 16 of the 18 officials around the table wrote down at least one more hike this year. On Friday, in Tokyo, the Bank of Japan followed with its own 25 basis points, to 1.25%, on a split 7 to 2 vote.
Nothing that landed between the two meetings argued for a pause. August retail sales came in at +1.2% against +0.8% expected, jobless claims fell to 196,000, and the Philadelphia Fed’s factory index printed 37.8 against 30.5. So Polymarket now prices 84% odds of another hike in 2026, and only 8% odds of a recession this year.
The S&P 500 closed the week down 0.1%. That is the calmest reaction to a hike I have seen, and it hides what happened to most members of the index, whose week was a very different one. The selling I described in my last letter went straight through the meeting, and the one group of stocks that got bought with both hands is the fleet carrying Gulf crude around Africa. The members of the index are paying for the hike while the index itself has not, and the trade is where the money went to hide.

Get the app. Every subscriber gets this letter. Paid readers also get the app it is written on.
What is inside:
Twenty-six screeners. They run every night on 12,000+ US stocks: pullbacks, breakouts, bottoms, squeezes, insider clusters, unusual options flow.
Sectors and themes. Which corners of the market lead and which lag against the S&P, which way each one is turning, and twenty-six themes tracked basket by basket: AI agents, defense tech, drones, critical minerals, the power grid, fintech.
Where the market stands. Breadth, rates and inflation, the dollar and the curve, commodities, crypto, and the sentiment gauges, all rebuilt after every close.
Who is buying. 13F books from 100+ funds, activist stakes, Congress disclosures, insider clusters, buybacks, federal contracts.
Your desk. Build your watchlist, set your price alerts, analyze your positions, keep your trading journal, and size your next trade.
The Academy, our private trading course. 35 lessons that take you from reading a chart to sizing a trade and a guide to every page in the app.
Start your 7-day free trial. Then $20 a month or $200 a year.
📊 Market Health
The hike went straight to the members of the S&P 500.
A rate hike lands on the companies that borrow, and the giants at the top do not. So one hike made two markets this week. The S&P 500, where each stock counts by its size, lost 0.1%. The equal-weight version of the same 500 stocks, where each one counts the same, lost 1.2%. The few giants that rose offset the hundreds that fell.
The damage shows in the breadth table. On Friday 3,461 stocks fell against 1,855 that rose, 318 made a 52-week low, and down volume ran twice up volume. The TRIN, the gauge that spikes when sellers panic, stayed near 1.0 all week. Broad, calm selling is how a market reprices, and it takes more than a week.
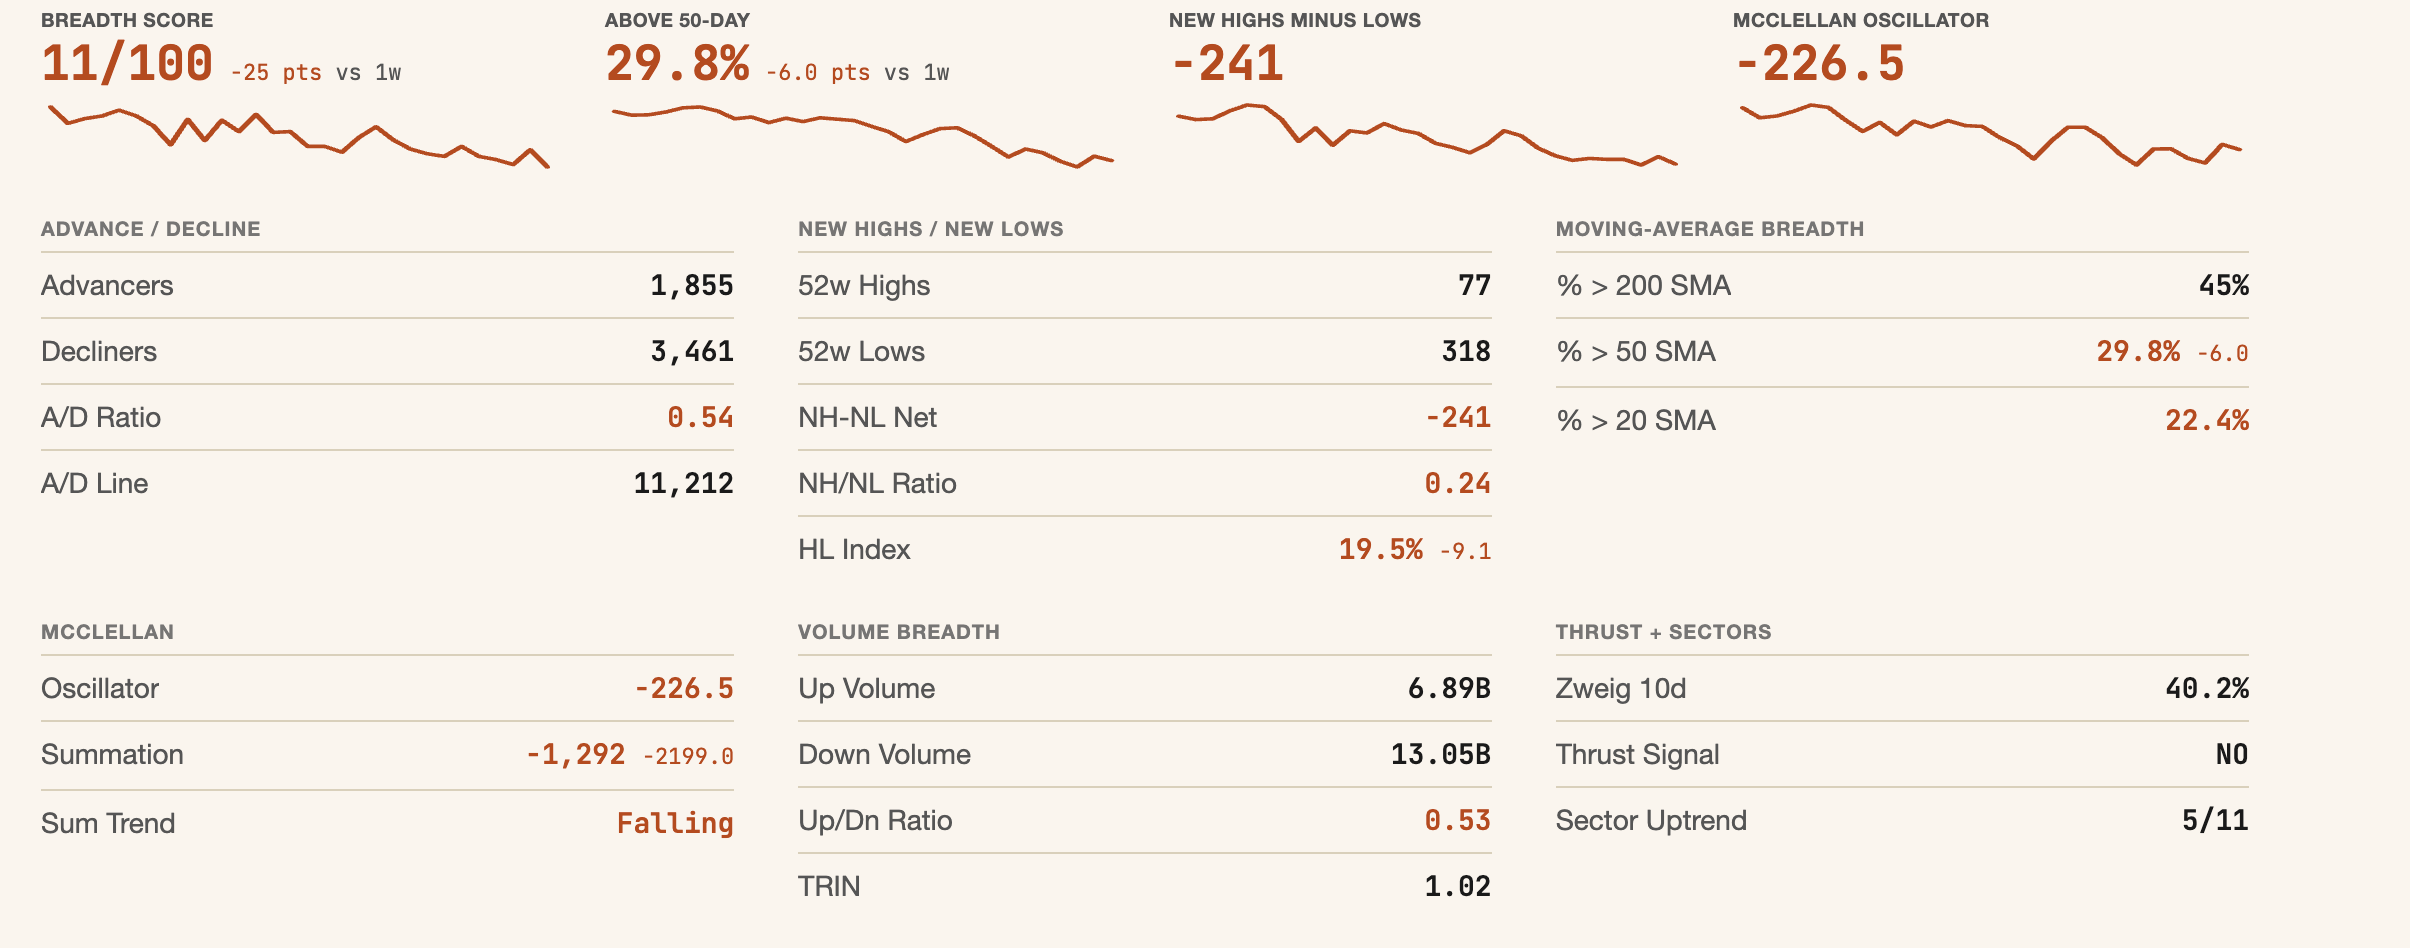
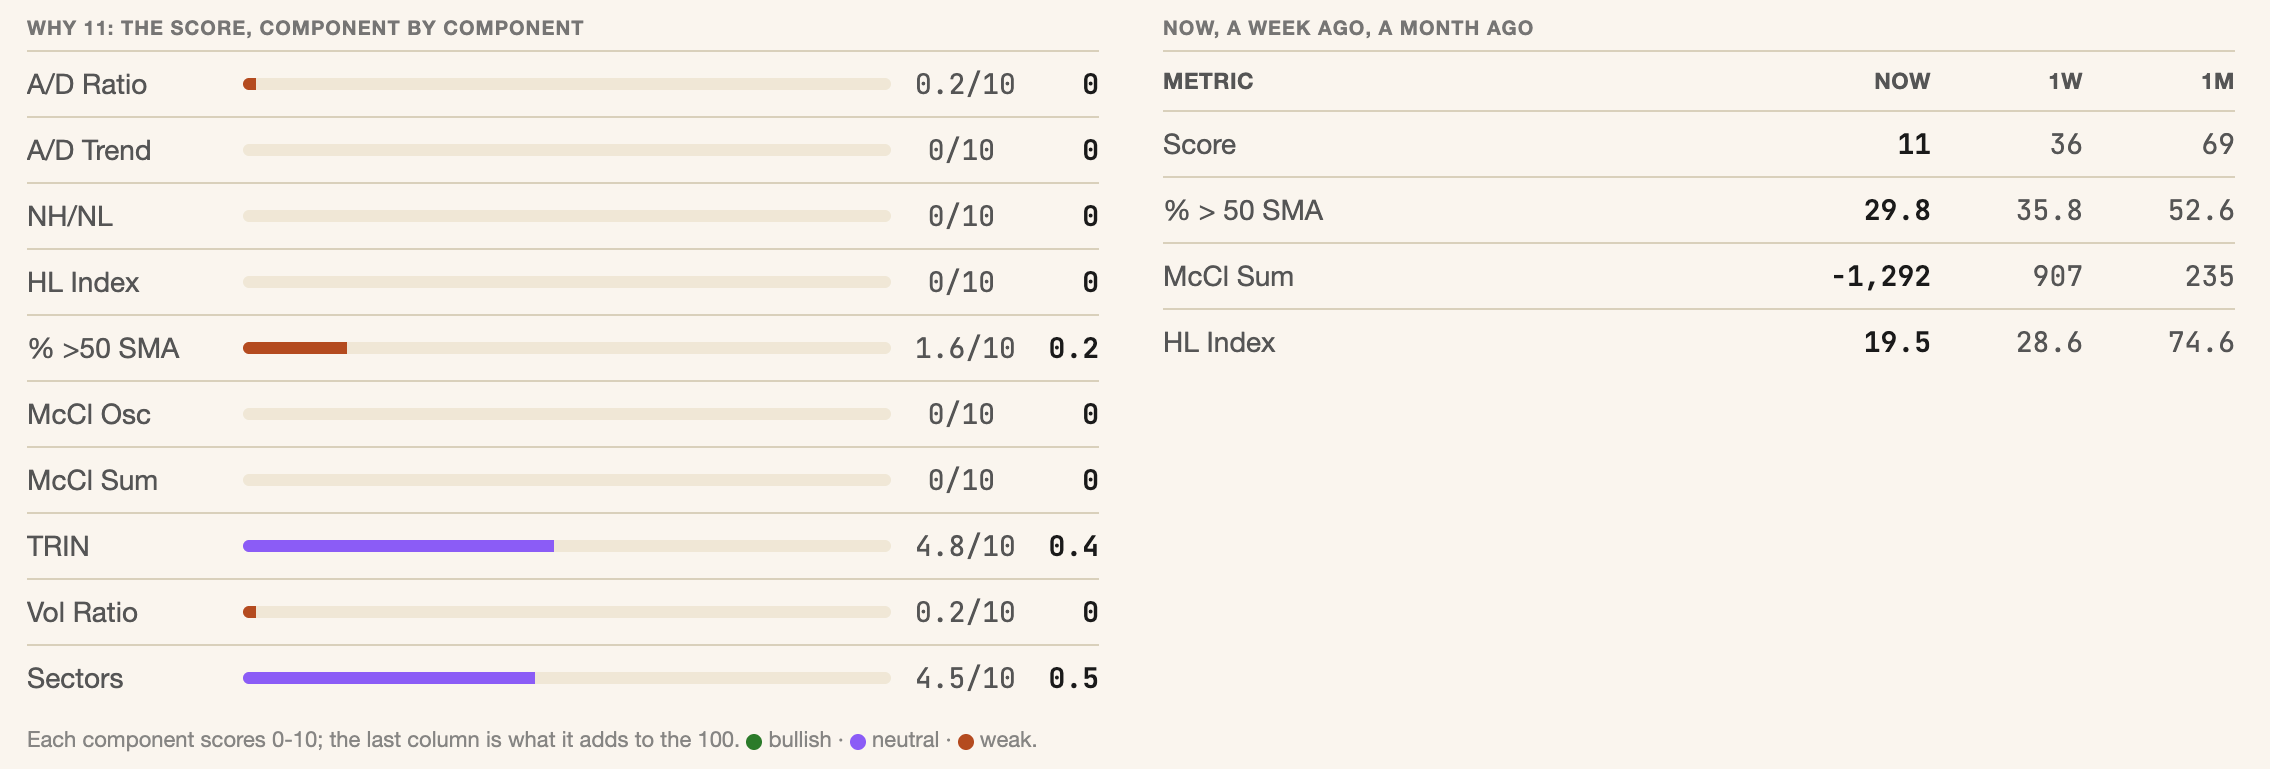
My health score, a 0 to 100 read of how many stocks hold their trend, fell from 36 to 11, and seven of the 10 readings inside it sit at zero. The two that hold are the calm of the selling and the sector count, and the sector count holds because energy does. Four weeks ago the score was 69.
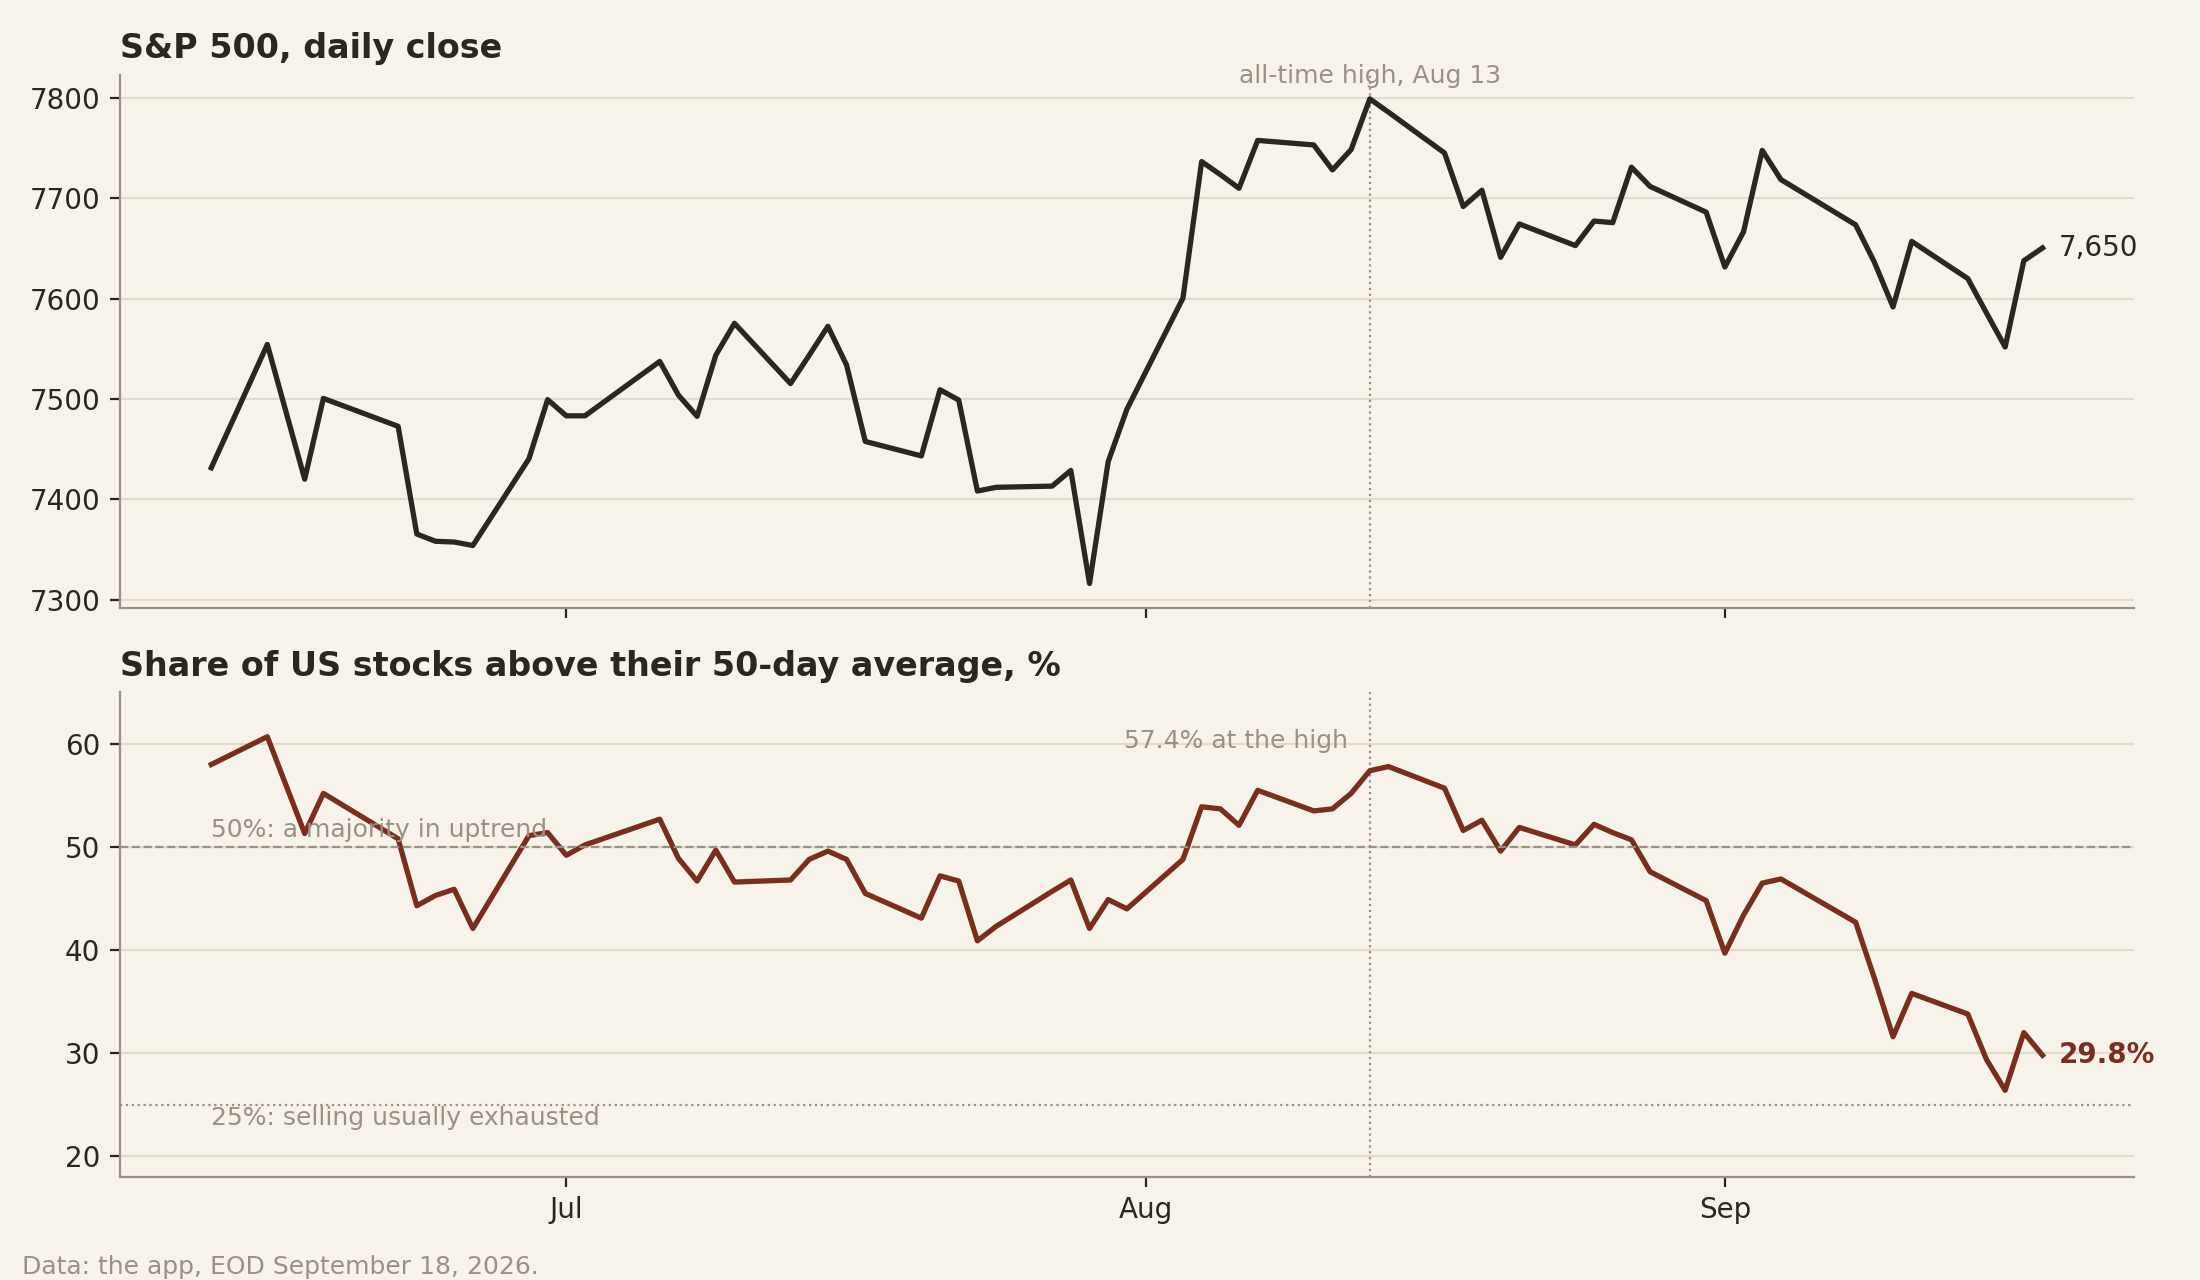
The S&P 500 can rise because most of its stocks rise, because short sellers are forced to buy back, or because a handful of giants carry it while the rest sinks. The chart below shows which one this is. On August 13, when the S&P 500 closed at its all-time high, 57.4% of stocks were above their 50-day average. On Friday 29.8% were, and the S&P 500 was only 1.9% lower.
Under 25%, selling has usually run its course. Wednesday touched 26.4%.
The regime reads defensive, the kind of market that has punished buying until breadth turned, and the chairman gave no reason to expect the turn from his side.
“The plain fact is that inflation is too high and has been for too long.” Kevin Warsh, September 16.
🚨 Sector Rotation
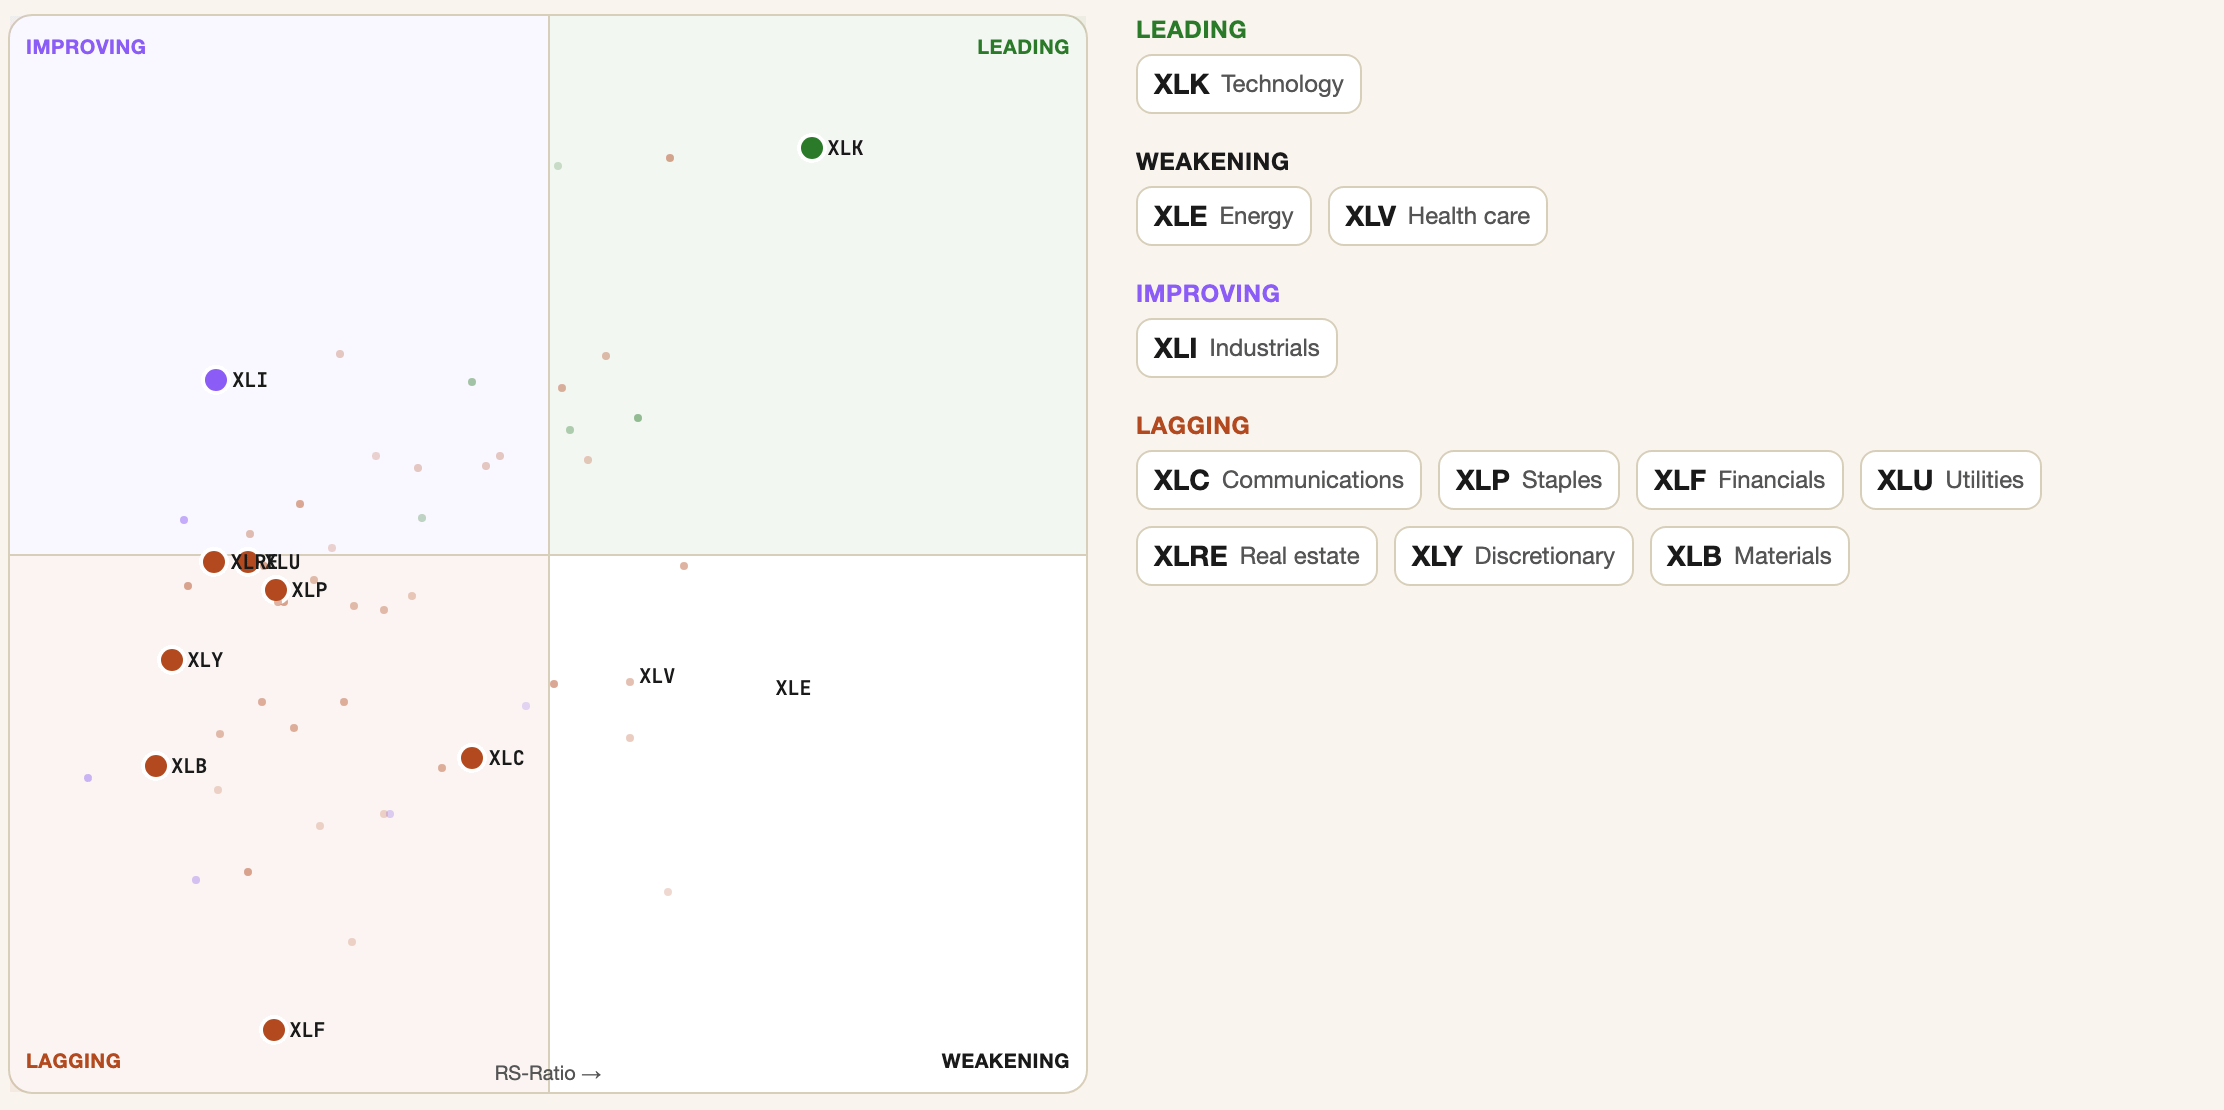
Technology leads the rotation graph while energy is the last sector with a majority of members above trend.
On my rotation graph technology is alone in the leading quadrant, energy and health care sit in the weakening one, industrials is the only sector improving, and the other seven lag. Against the S&P over 20 days technology is +3.7, energy +1.0, communications +0.2, and everything else negative down to utilities at -6.0. Yet the only sector where a majority of members still hold their 50-day average is energy, at 58.9%, down from 80.7% a week ago.
Materials lost its majority this week, 52.4% to 44.5%. Technology leads on price with 40.3% of its members above trend, the sector version of the whole market.
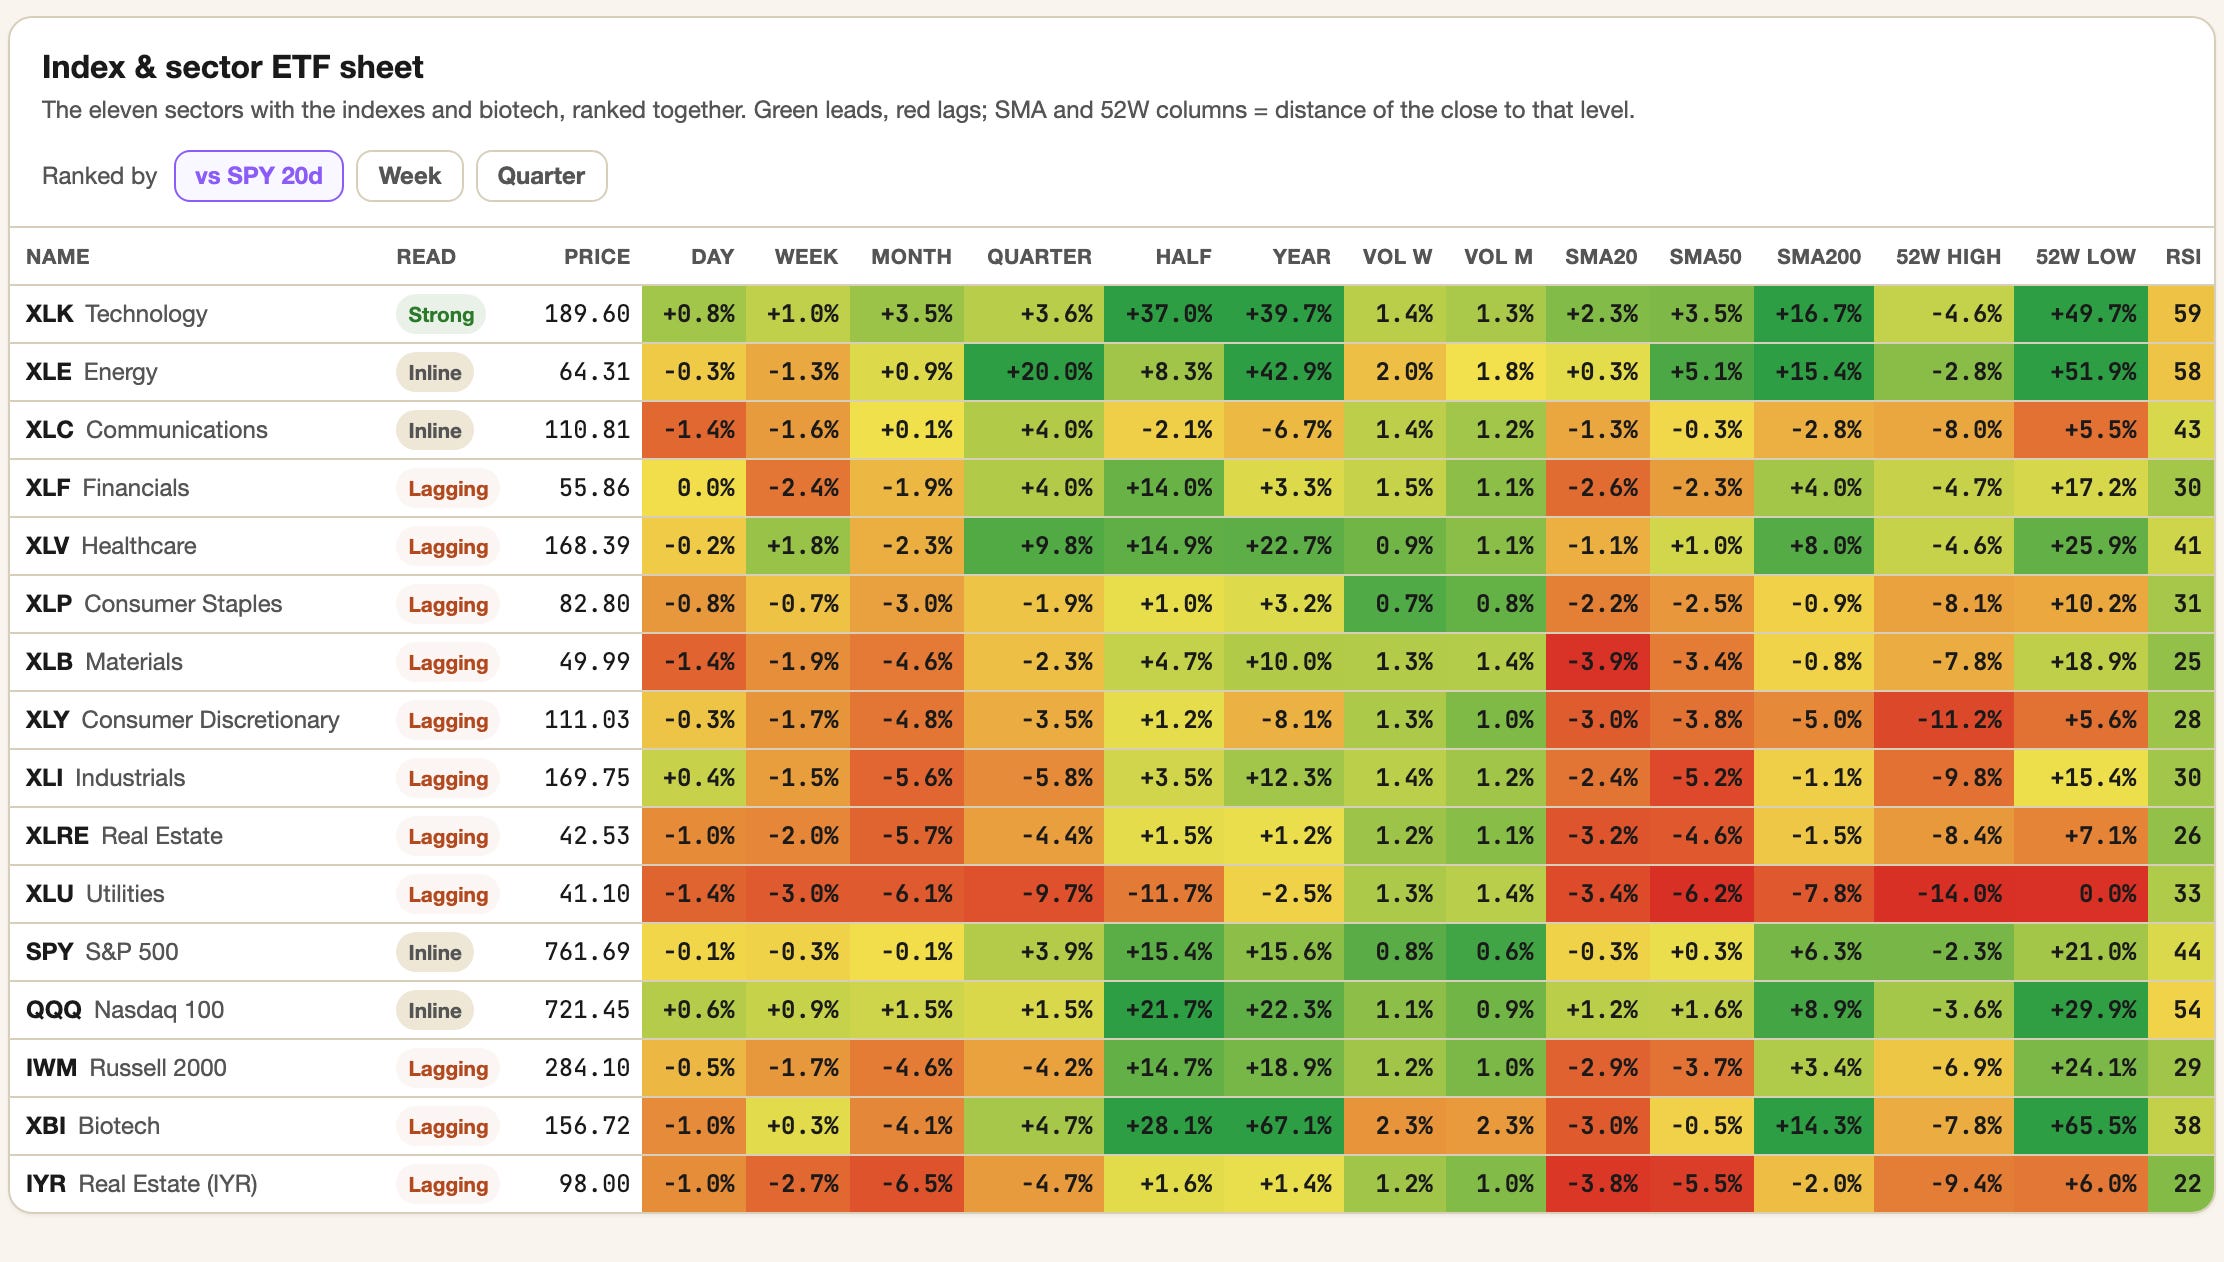
The ETF sheet shows where the hike landed. Utilities lost 3.0% on the week, 9.7% on the quarter, sits 14% under its 52-week high and exactly at its 52-week low, RSI 33. Real estate has 6.5% of members above trend. Both are priced off a 10-year that closed at 5.006% on Wednesday.
Financials went from 40.9% to 26.9% of members above trend, with BAC down 7.9%, because a hike that lifts the 2-year about 10 basis points and the 10-year 2 basis points flattens the curve a bank lends on. My app also says cyclicals beat defensives by 1.6 points over 20 days and reads it as risk appetite. I read it the other way: utilities, real estate and staples are bond proxies, the bond just repriced, and defensives are being sold for the same reason banks are.
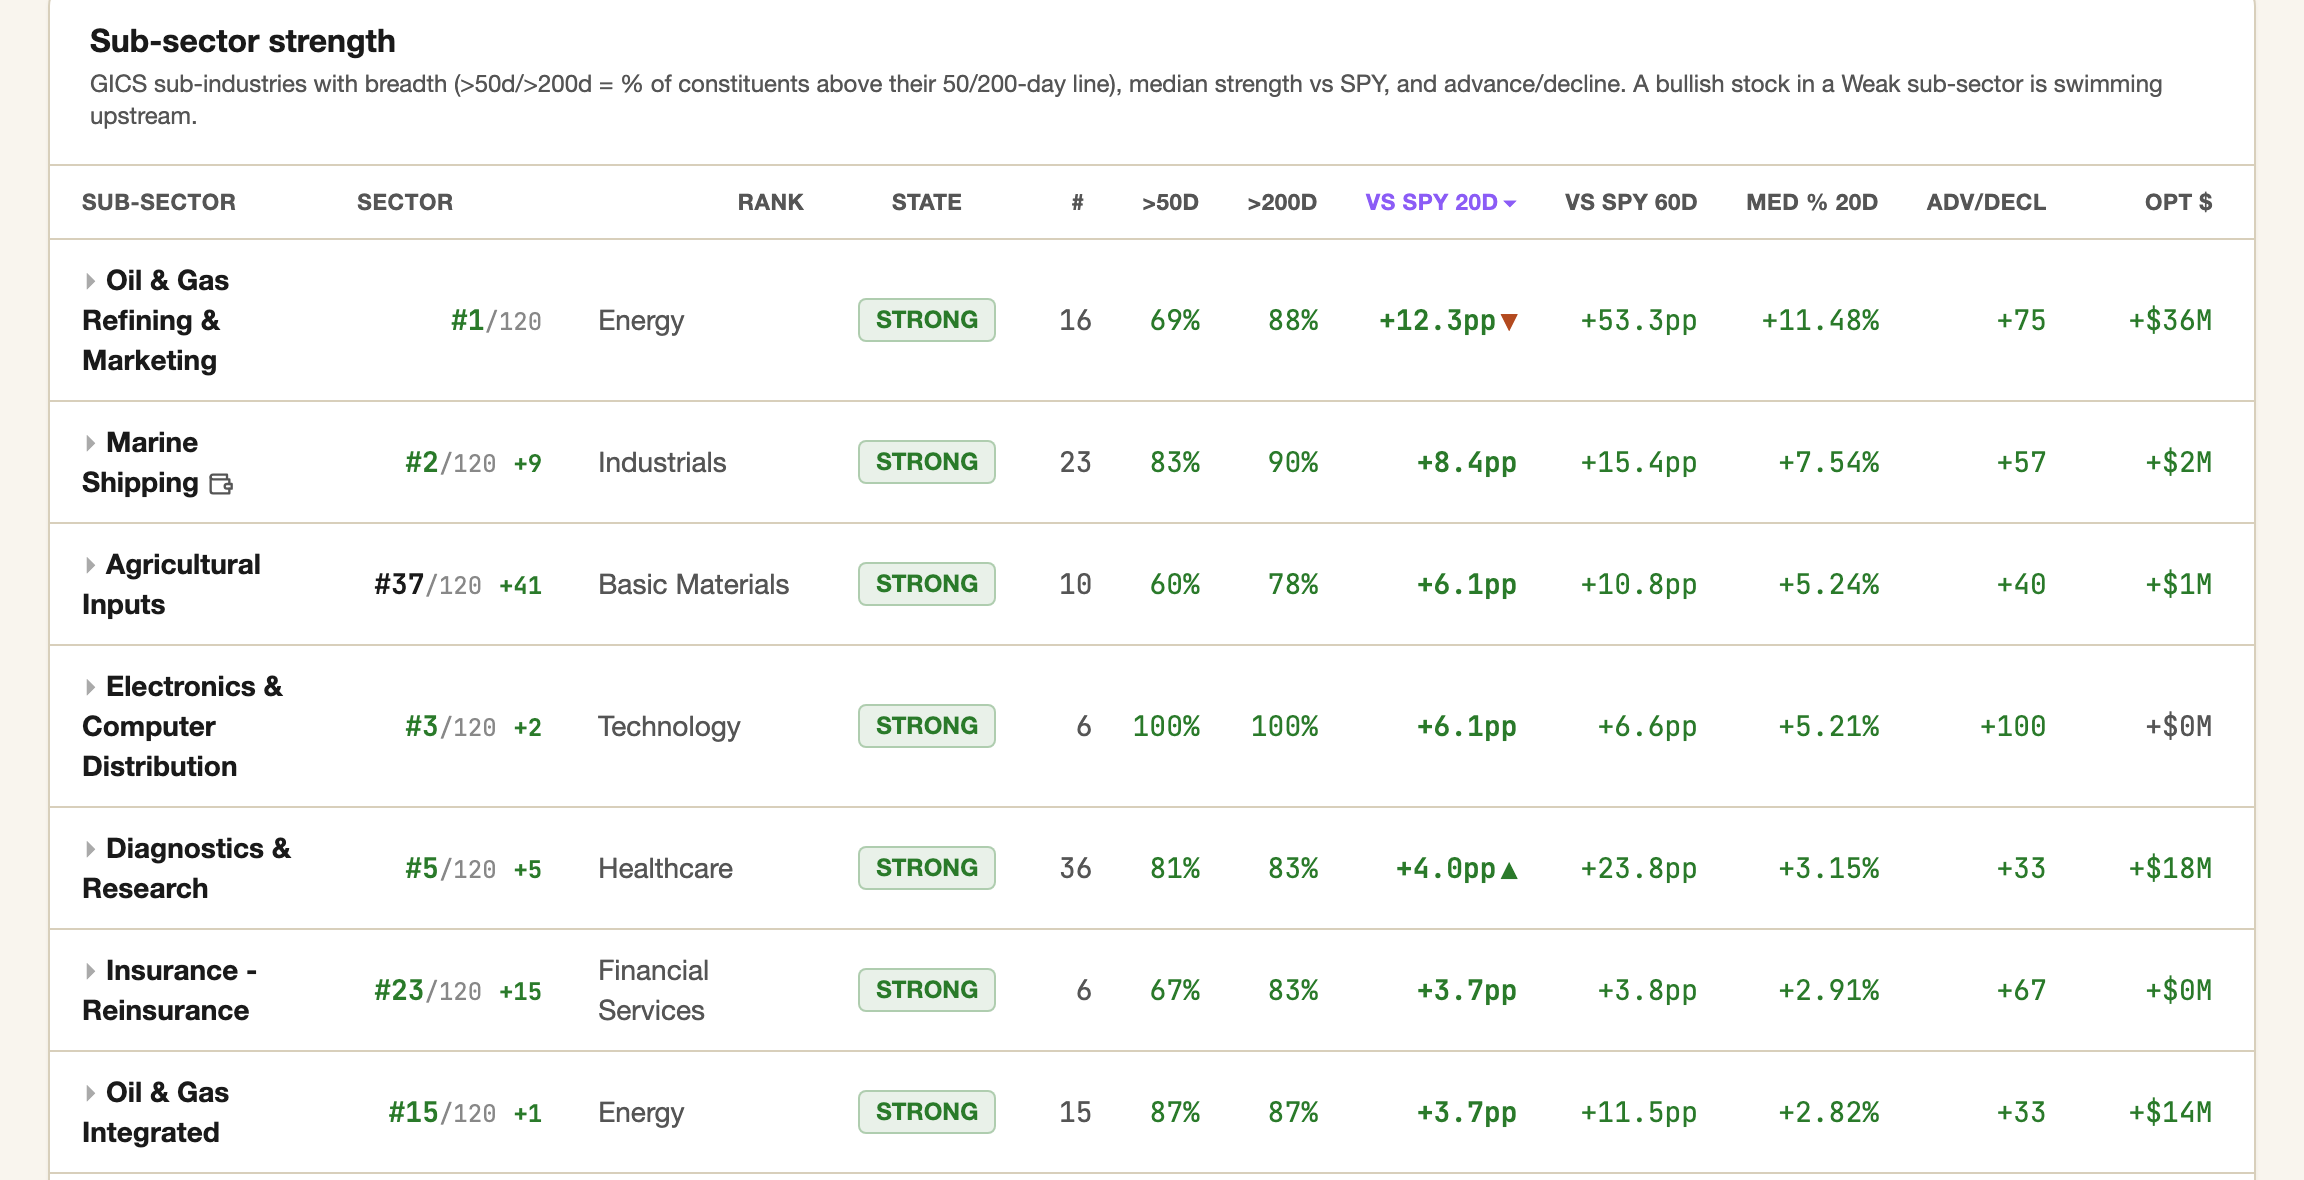
Next to energy, the money moved from the barrel to the boat. Marine shipping is the second strongest of the 120 industries I track, up 2 places in a week and 9 in a month, with 83% of its 23 names above trend. That group is containers and dry bulk, and the crude tanker owners, listed under energy, did even better: Nordic American +10.6%, Torm +9.0%, International Seaways +7.2%, DHT +5.8%. Clarksons Research counted why on September 16.
Traffic of VLCCs, the largest crude tankers, through Bab el-Mandeb is 80% below the second quarter. About half of Red Sea crude now moves through the Suez pipeline system and then around the Cape of Good Hope instead, and 15% of the supertanker fleet sits off Oman doing ship-to-ship transfers. Longer routes and idle ships remove capacity at the same time, so by Friday September 12 the average VLCC earned $451,000 a day, up 68% in a week, a record. Tanker owners are paid by the mile, and this week the miles went up.
Then there is health care, which I cannot explain. It went from the worst sector at -3.6% to the best at +1.8% in a week, and the move came from lab equipment: TMO +6.8%, Agilent +6.5%, Danaher +5.8%, and Quest Diagnostics at a new 52-week high in a week with 318 new lows. My Breakout screener, built to catch stocks pushing through a ceiling on strength, has 9 biotech or genomics names in its top 10, with 10x Genomics +16% and Twist Bioscience +23% in the five sessions to Thursday.
The sector’s breadth barely moved, 33.4% above trend against 33.7% a week earlier, so this is a cluster, and a cluster that size has a cause. A rotation into safety does not lift a genomics tools company 16% in a week. Something else is buying, and I do not know what yet.
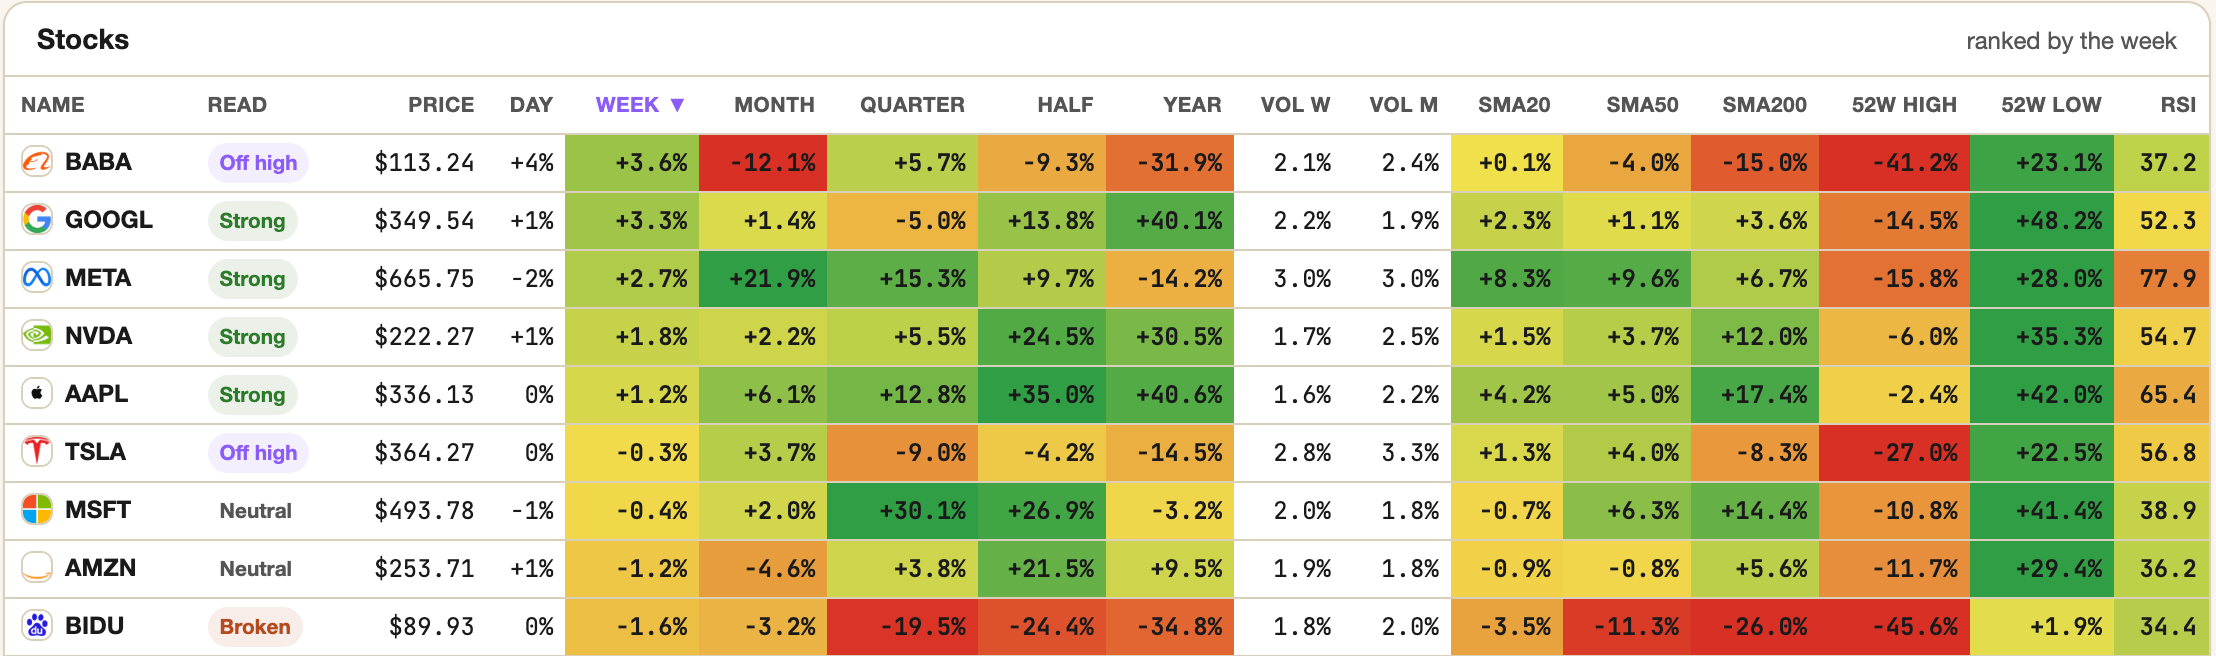
The megacaps themselves are not one block anymore. In the table of the largest names, Alphabet, Meta, Nvidia and Apple read strong, Meta up 21.9% on the month with an RSI of 77.9. Microsoft and Amazon read neutral, both more than 10% under their 52-week high. Netflix reads broken, down 7.2% on the week and 42.5% from its high.
The index stands on four names, and MU, up 4.2%, gave the Nasdaq-100 its 0.9% week. The SOXX semiconductor ETF fell 5.6% on Monday after Dario Amodei's weekend essay calling on AI labs to slow down, and recovered by Friday.
📉 Volatility
The Fed hiked and the VIX finished the week lower than it started.
The VIX went from 15.84 to 14.81, with a Wednesday close at 17.71 and a high of 18.94 on the decision. VIX9D fell 23% on Thursday and another 8.4% on Friday to 12.27.
Options carried a premium for the meeting, the premium bled out in 48 hours once it passed, and $7 trillion of options expired on Friday, the second largest triple witching on record according to Citadel Securities. That leaves the VIX lower than on 93% of the days this year, in a week when 318 stocks made a 52-week low. Index protection is cheap at the moment most stocks need it.
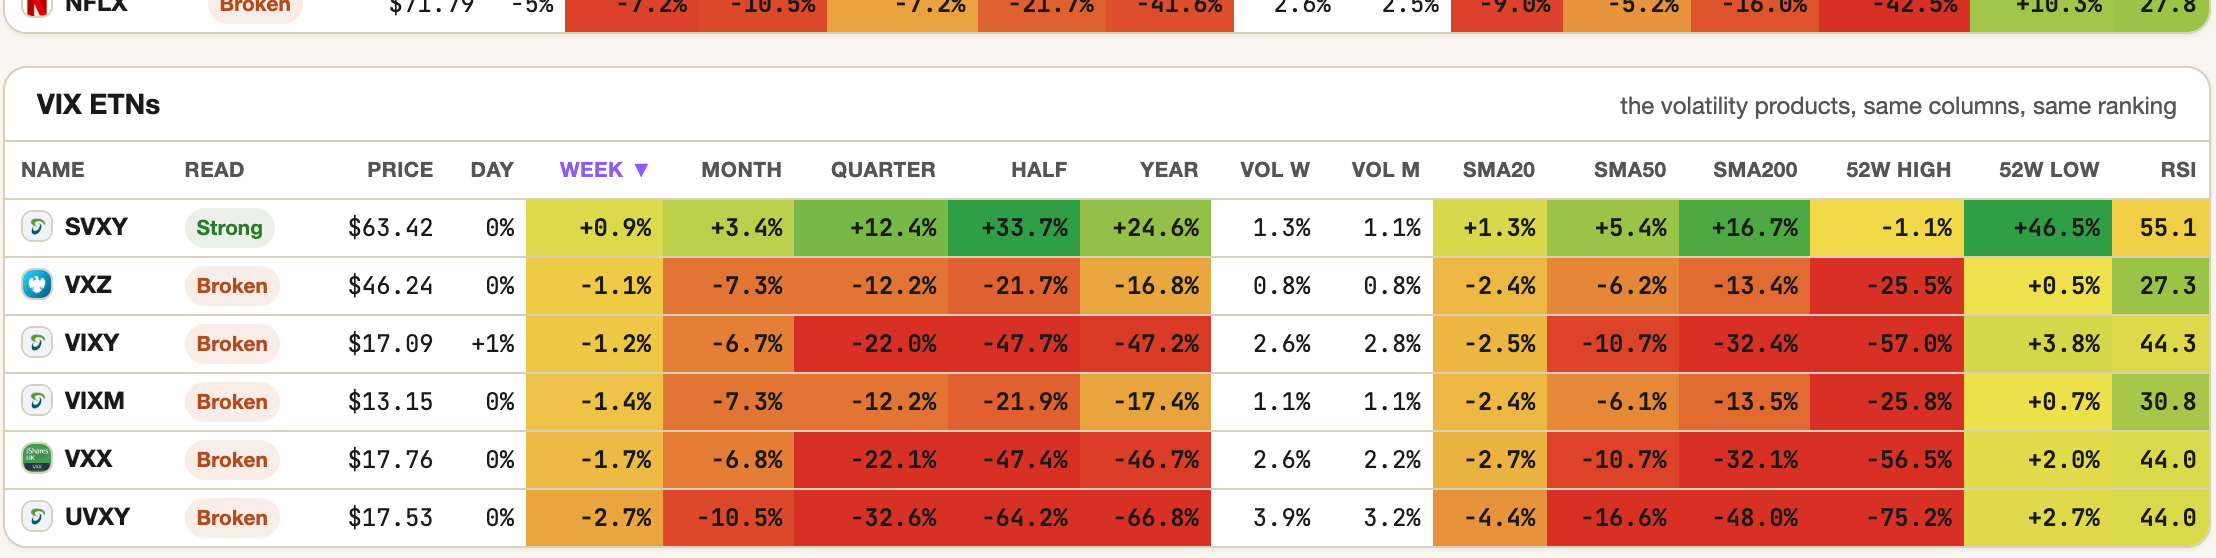
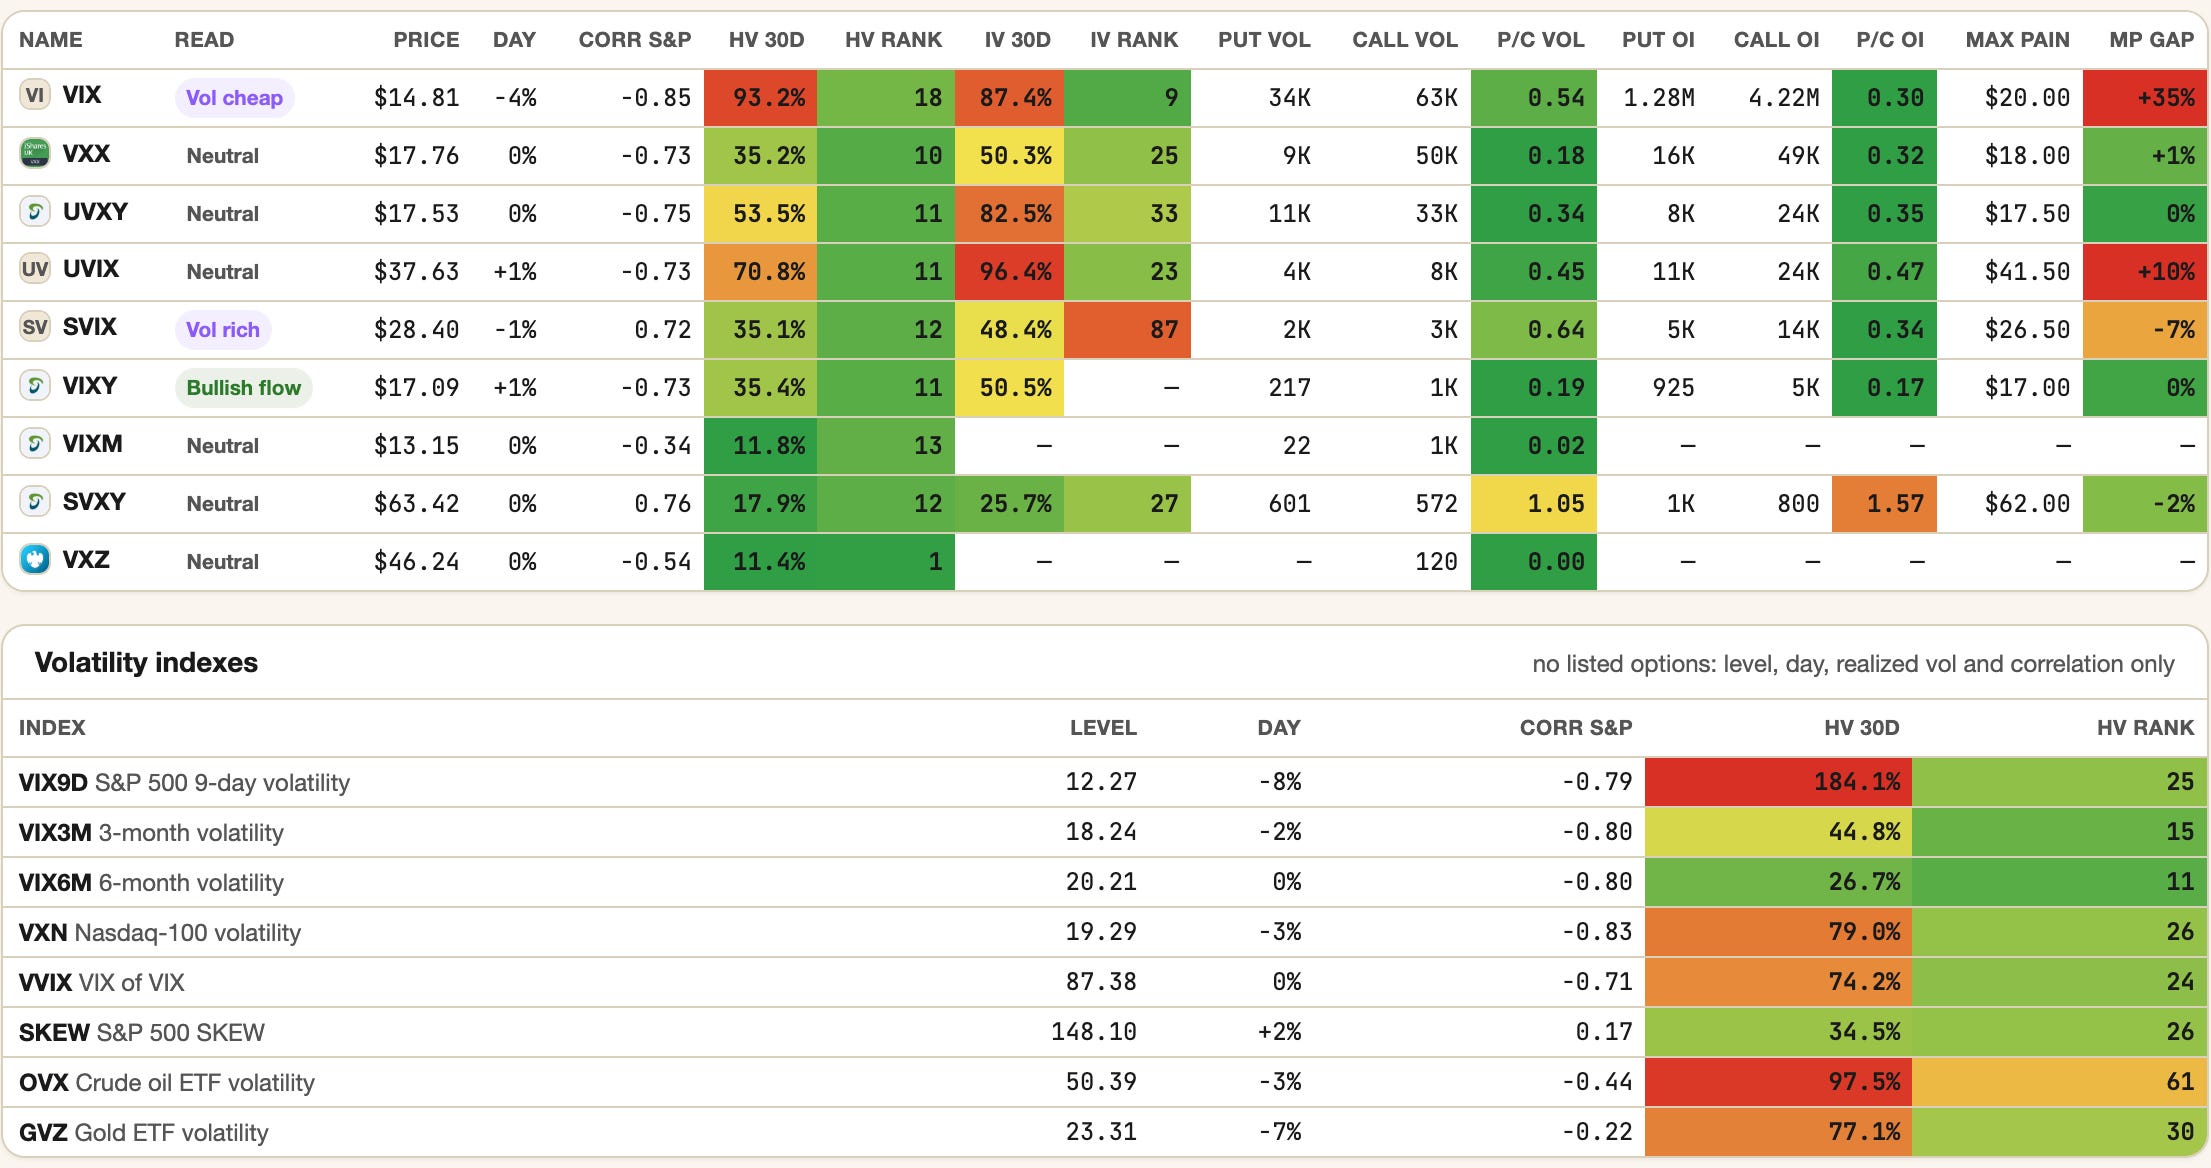
The table in the app that ranks the volatility products shows the same thing. SVXY, which profits when the VIX falls, reads strong and is up 33.7% over six months. UVXY, which profits when it rises, reads broken and is down 64.2% over the same six months, 75% under its 52-week high.
Every VIX product in that table reads broken except the one that sells volatility, and short-volatility trades that crowded unwind fast.
The options sheet puts a price on that. VIX options carry an implied volatility rank of 9/100, which my sheet labels vol cheap, and the put-call ratio on them is 0.54: buyers are paying for VIX calls, a bet that volatility rises, near the cheapest price of the year. The strike where the most option money expires, max pain, sits at $20, 35% above the spot.
The one product that reads vol rich is SVIX, the short-volatility fund, with a rank of 87/100: the market charges a premium to insure the trade that is short volatility and discounts the trade that is long it.
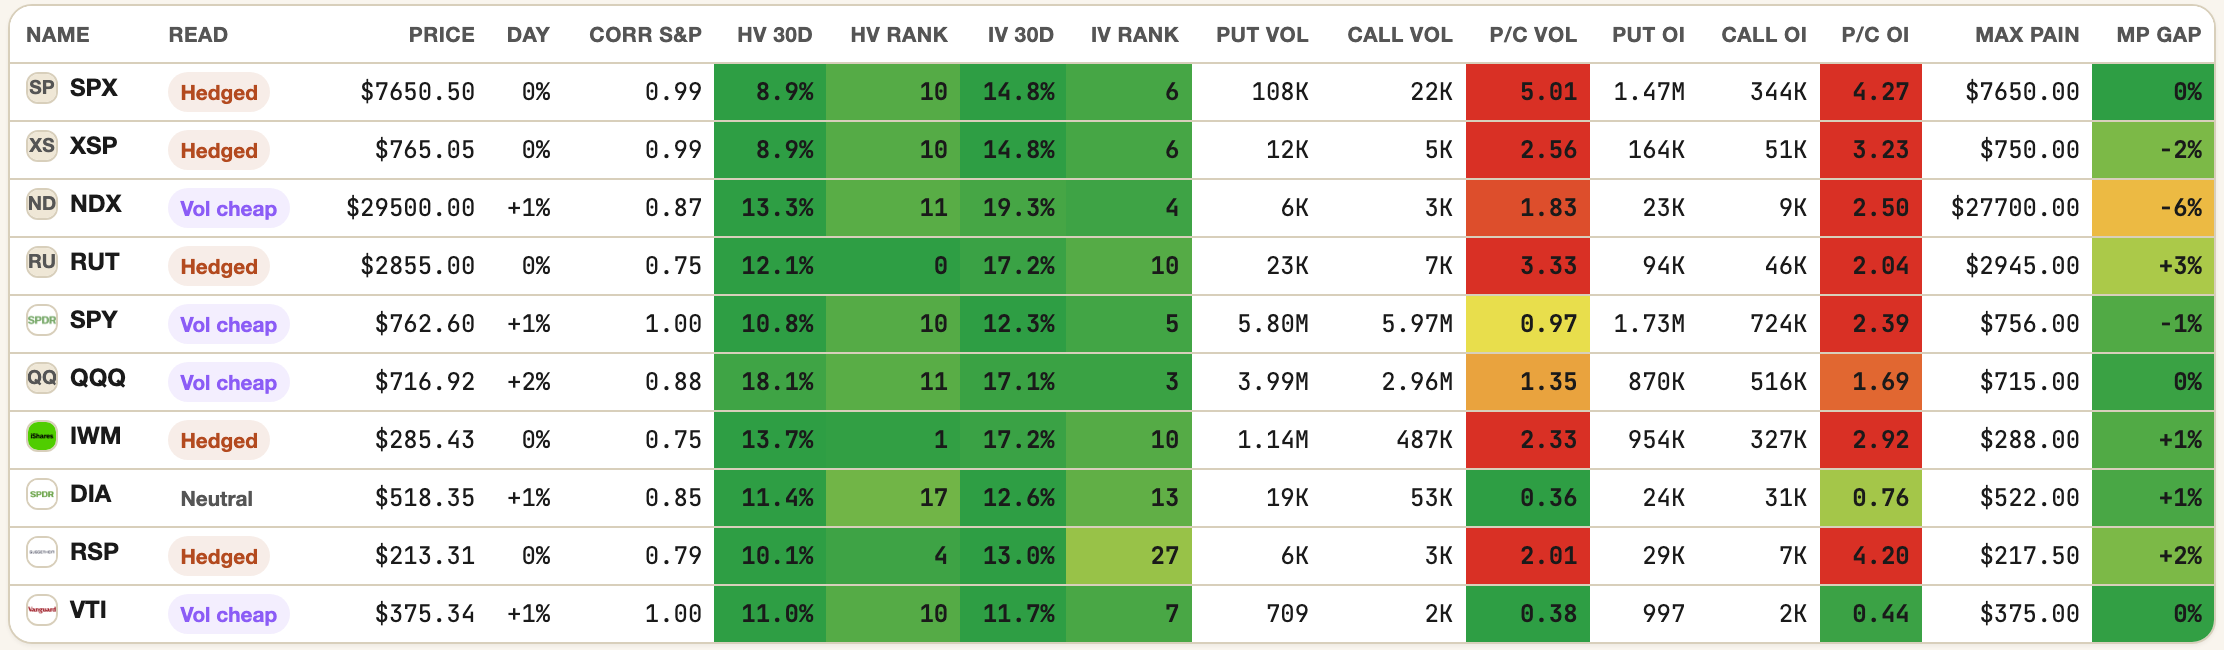
On the index side the sheet reads hedged. SPX options ran a put-call ratio of 5.0 on Thursday and 4.3 in open interest, and SPY’s own options sit at an implied volatility rank of 5/100 with a put-call of 2.4 in open interest. Hedged and cheap at the same time means holders bought insurance and the insurers did not raise the price.
Somebody is wrong. On September 11 I flagged the same gap, and the index fell to 749.60 within three sessions.
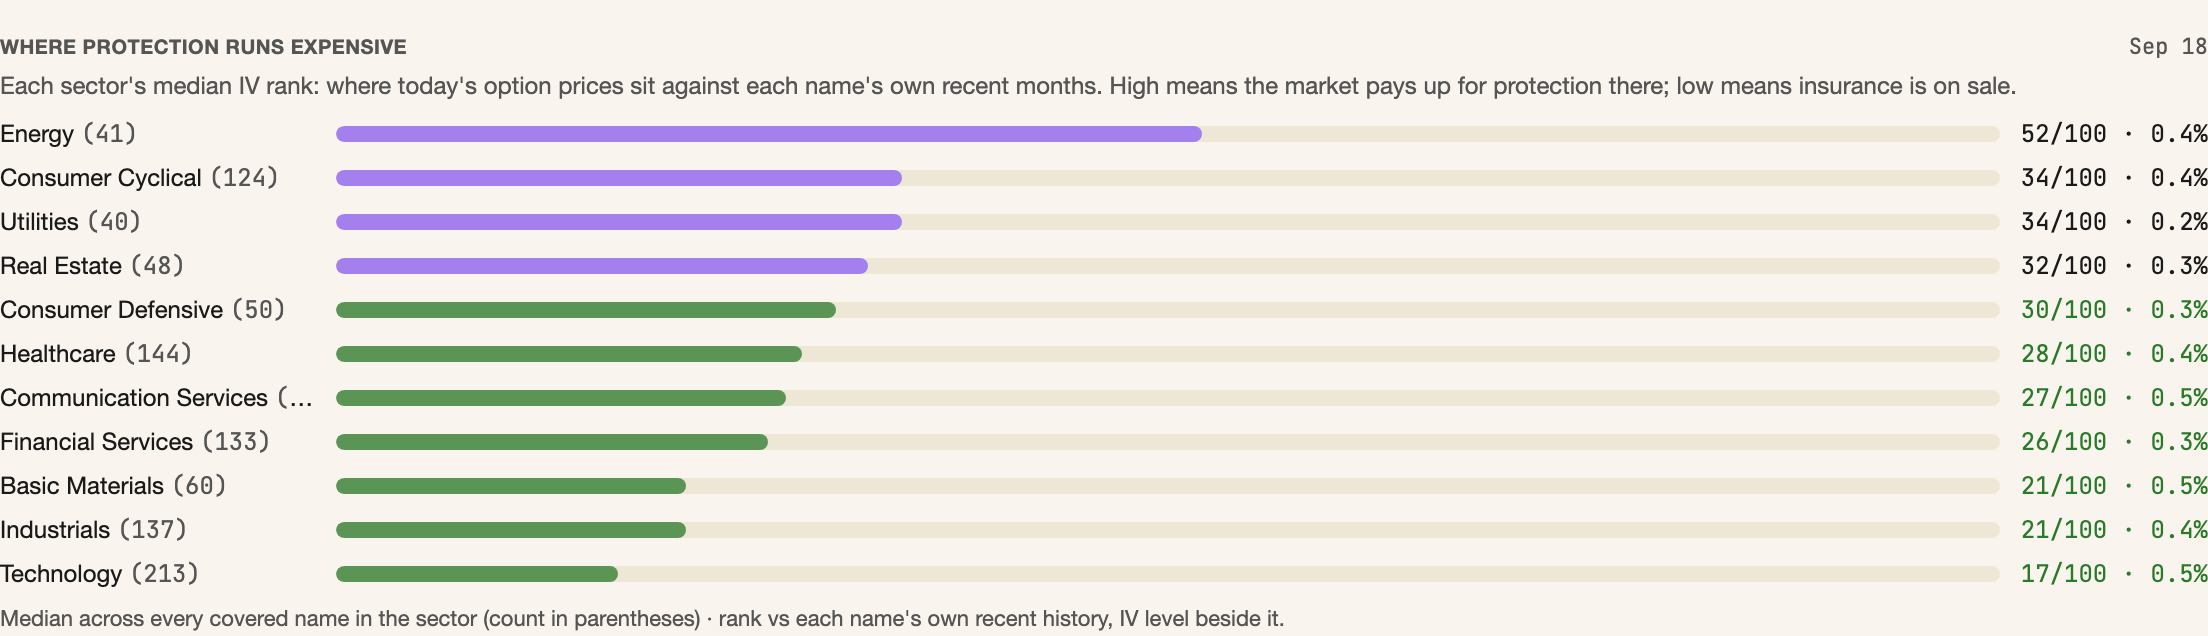
Where the insurance is expensive says who is scared of what. The median implied volatility rank by sector is 52/100 in energy and 17/100 in technology. The market pays up for protection on the one sector where a majority of members still hold their trend, and gives protection away on the sector that carries the index with 60% of its members below their 50-day average.
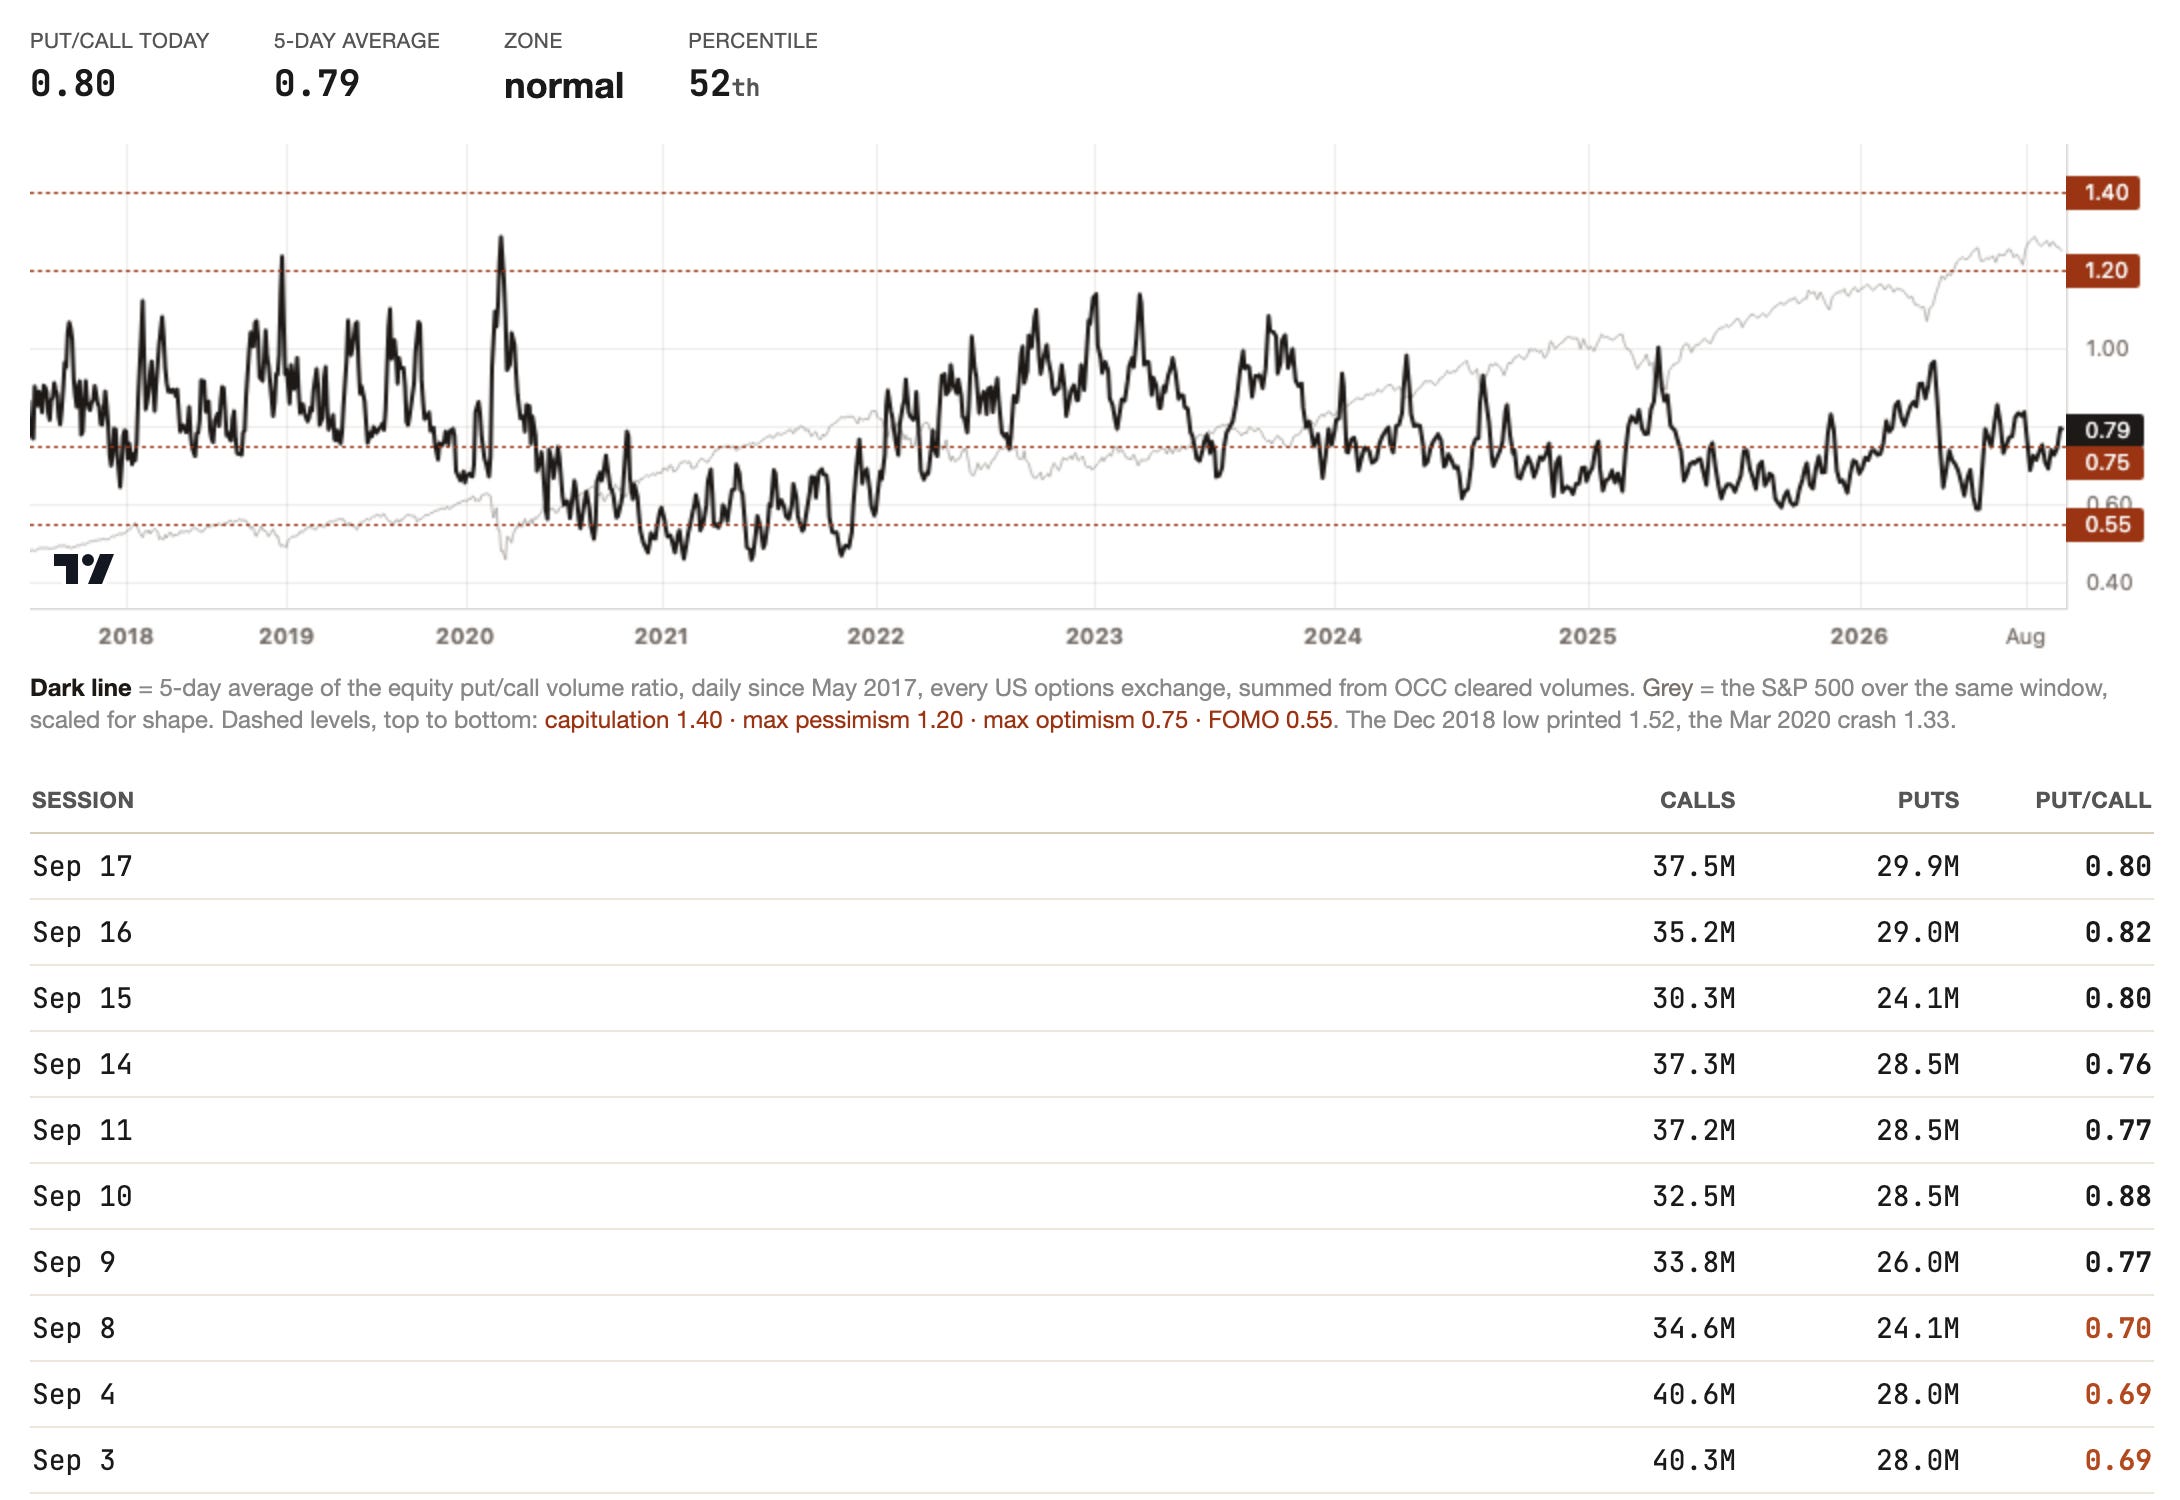
Put buyers kept their positions through the week. The put-call ratio across every US options exchange went from 0.76 on Monday to 0.82 on Wednesday and 0.80 on Thursday, a week after it printed 0.69 with the S&P 500 at its high. Protection was added into the meeting and kept after it.
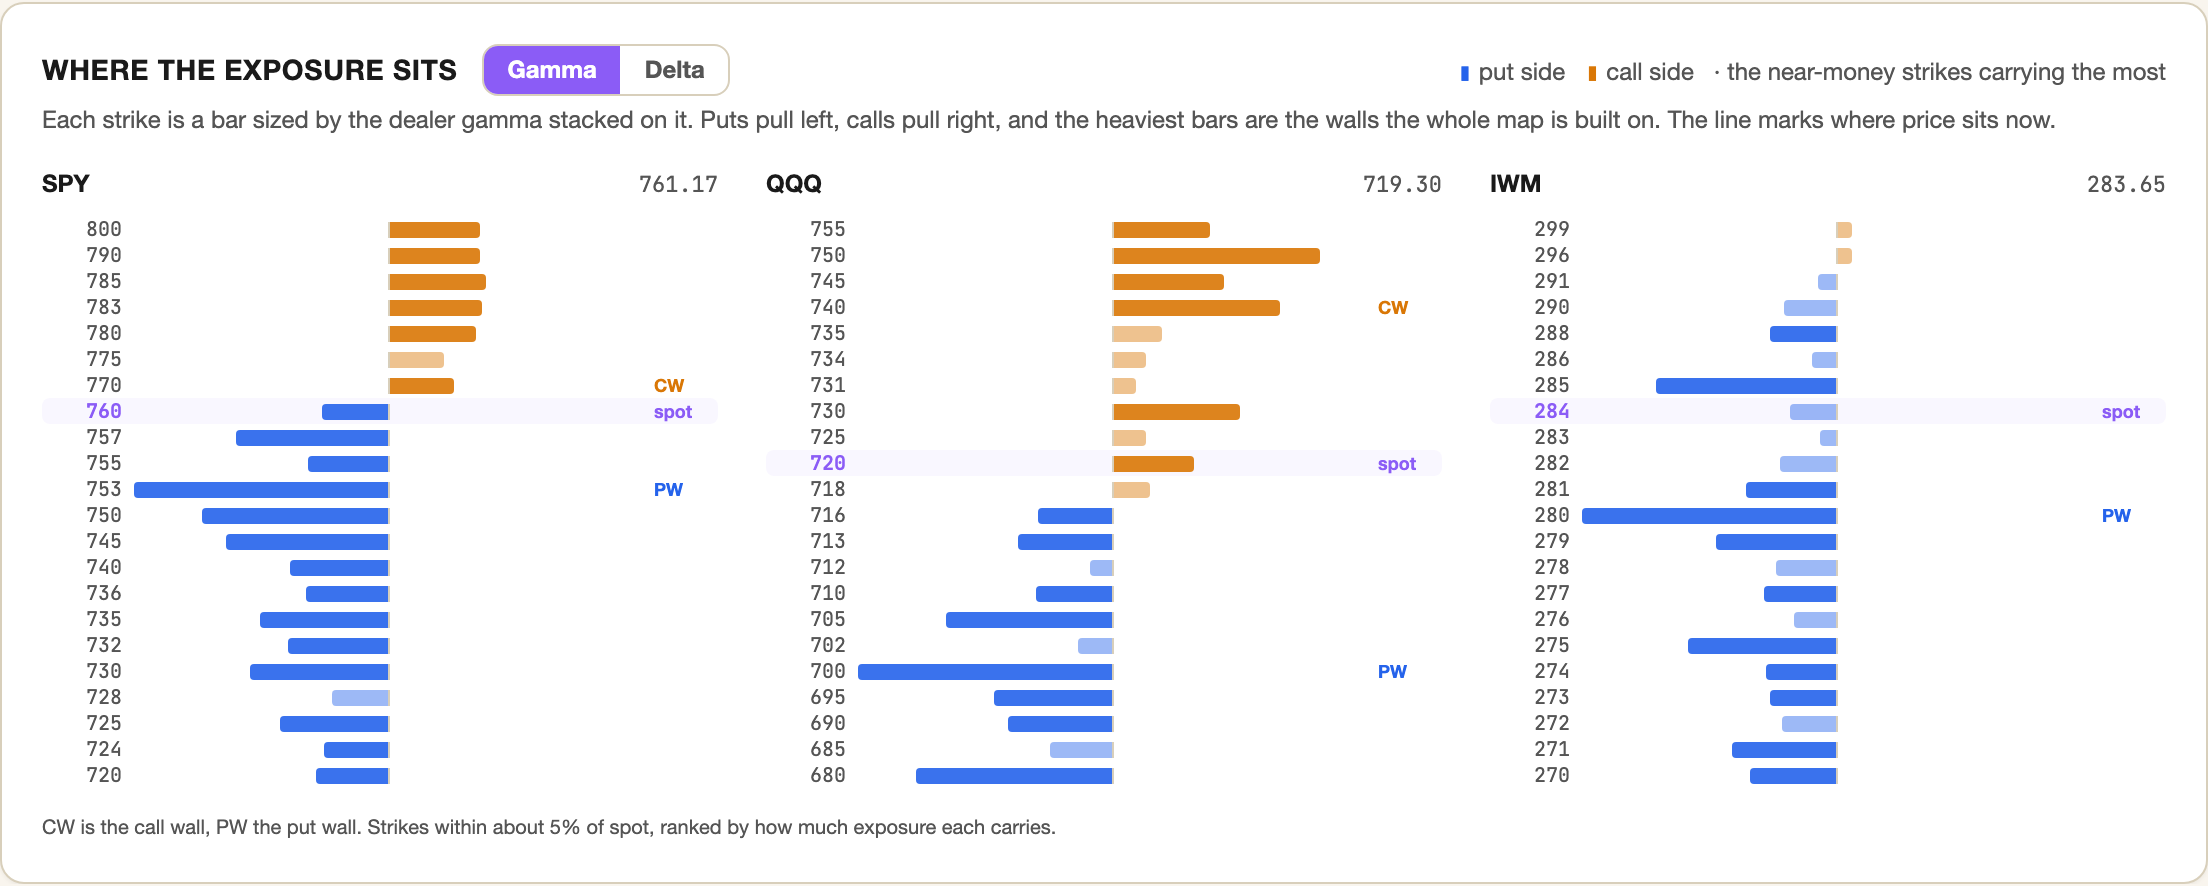
Wednesday’s low on SPY was 749.60, inside the 770 to 745 zone I gave you a week ago as the range dealers would defend, and the bounce came from there. The put wall has moved up, from 745 to 753, while the call wall still sits at 770, and SPY closed at 761.69, 1.1% under one and 1.2% above the other. Dealers are short gamma across the band, which means they sell into a decline and buy into a rally instead of leaning against them. A 2.2% band with dealers who amplify on both sides means the first wall that breaks decides the next 5%, and under 753 the dealer map shows two more floors, at 750 and 745, before the index is in open air.
💱 FX
The yen gave back a week of gains in five sessions, through a Bank of Japan hike.
The yen, the strongest currency of the week ending September 11 at 153.55 to the dollar, closed this one at 156.86, a 2.1% fall, and the drop ran straight through Friday’s hike to 1.25%. The vote was 7 to 2, the two dissenters wanted no hike at all, and Governor Ueda committed to nothing further. A hike delivered with a split board and no path reads as the last one.
The Fed, two days earlier, had shown most of its committee wanting more, so the expected rate gap that funds the carry trade widened in a week when both banks hiked 25 basis points. Every trade funded in yen got cheaper to hold, and that is part of why the Nasdaq-100 finished the week up while most of the market finished down.
“That depends on how price conditions develop. There could be various possibilities. We shouldn’t rule anything out.” Kazuo Ueda, asked whether the Bank could hike by 50 basis points or at back-to-back meetings, September 18.
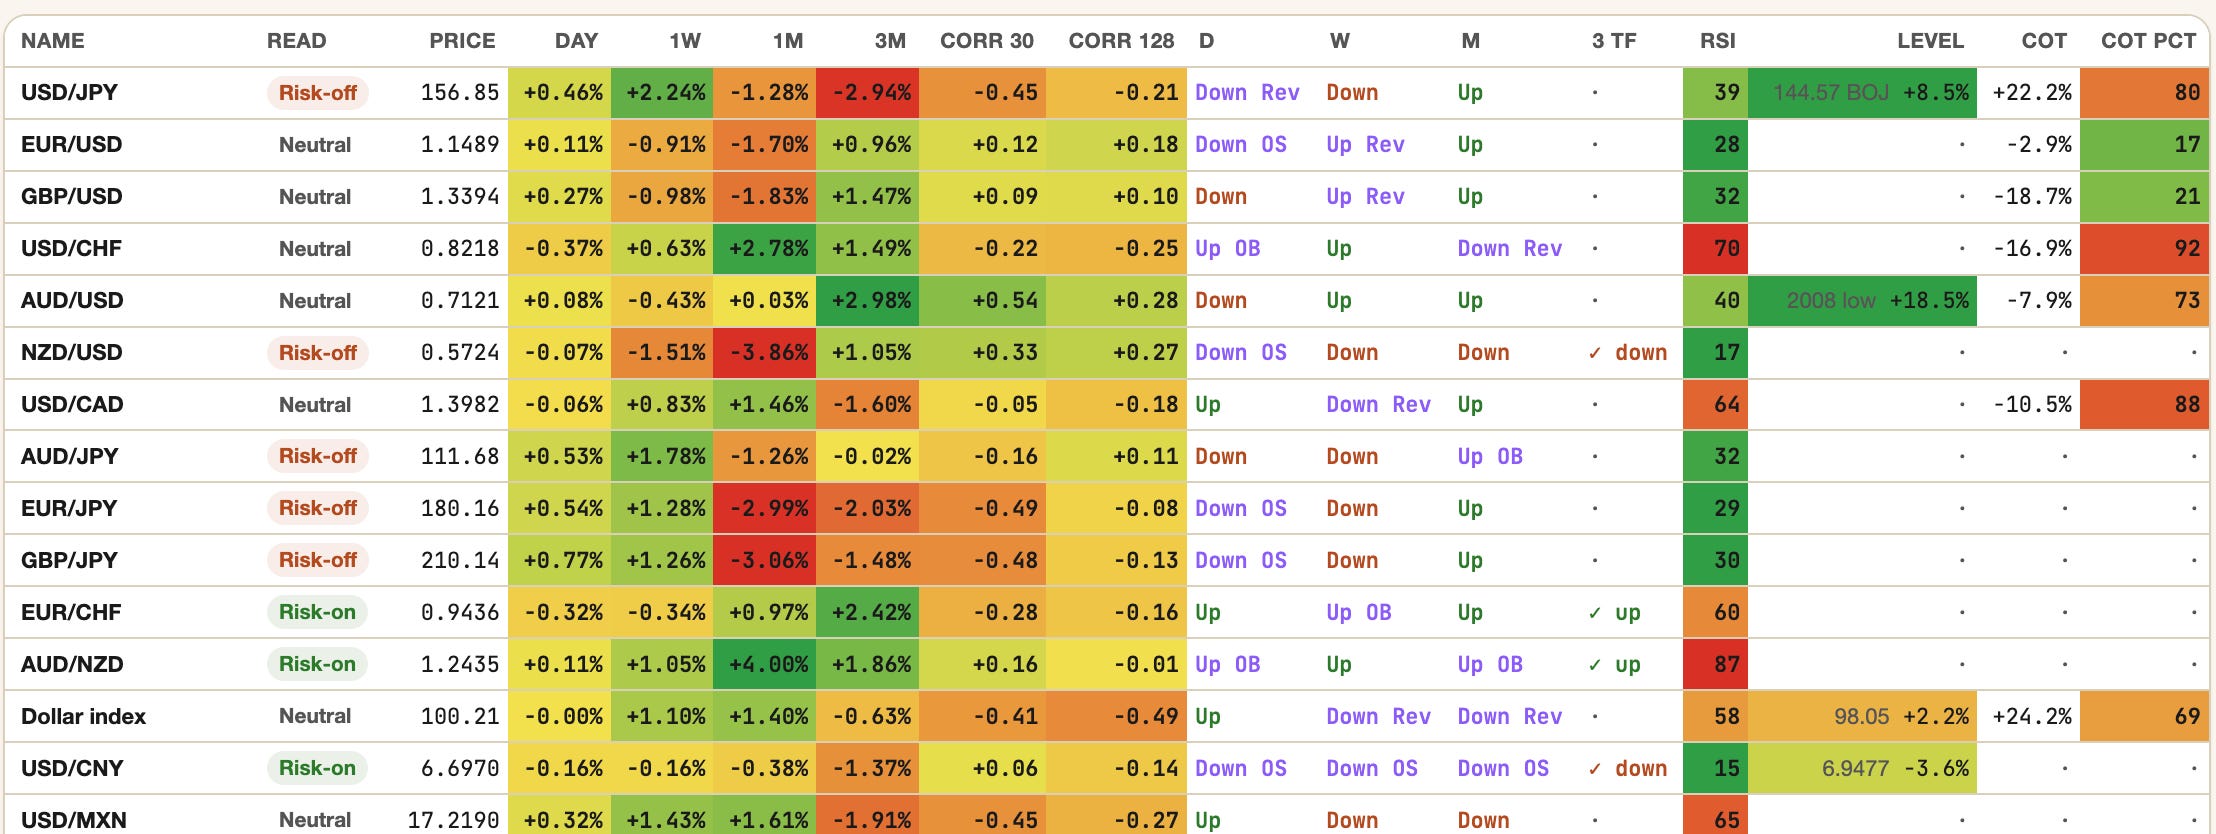
My FX sheet now carries the futures positioning from the weekly Commitments of Traders report, and it explains why the yen could not hold its rally. Speculators were net long yen futures at 22% of open interest going into the meeting, a bigger bet on the yen than in 80% of the past three years. They had bought the hike in advance.
When the hike came with two dissents and no path, there was no one left to buy, and the longs sold into it. The same report shows them long the dollar index at 24% of open interest, so the dollar had buyers waiting on the other side. The sheet tags 7 pairs risk-off and 5 risk-on, all four yen crosses in the first group, and reads the kiwi as the clean one: down 3.9% on the month with an RSI of 17.
That closes, for now, the unwind I was watching. In July 2024 a yen rally met a Bank of Japan hike and the S&P lost more than 8% in three weeks from its July 16 peak. This time the rally met the hike and reversed, so the unwind risk is off the table until the yen turns again, and with the yen longs now cut back, the next rally would start from a cleaner position.
The dollar index rose 1.1% to 100.22 and took the exporters’ currencies down with it, the Korean won 3.1% on the week. The franc fell 0.6% against the dollar on the week and 2.8% on the month. Gold futures gained 1.2% to $4,419, still 17% under their January record, though gold’s 60-day momentum reads +5.6% and my haven gauge calls it flight to safety.
My risk-off recipe needs the franc rising while stocks fall and volatility spikes, and this week stocks fell, the franc fell with them and the VIX closed lower, so one condition of three. A hike pays whoever holds dollars, so the dollar is the shelter this time, and a franc falling with stocks instead of against them says the market is pricing a rate problem, and nothing worse yet.
🧠 My Take
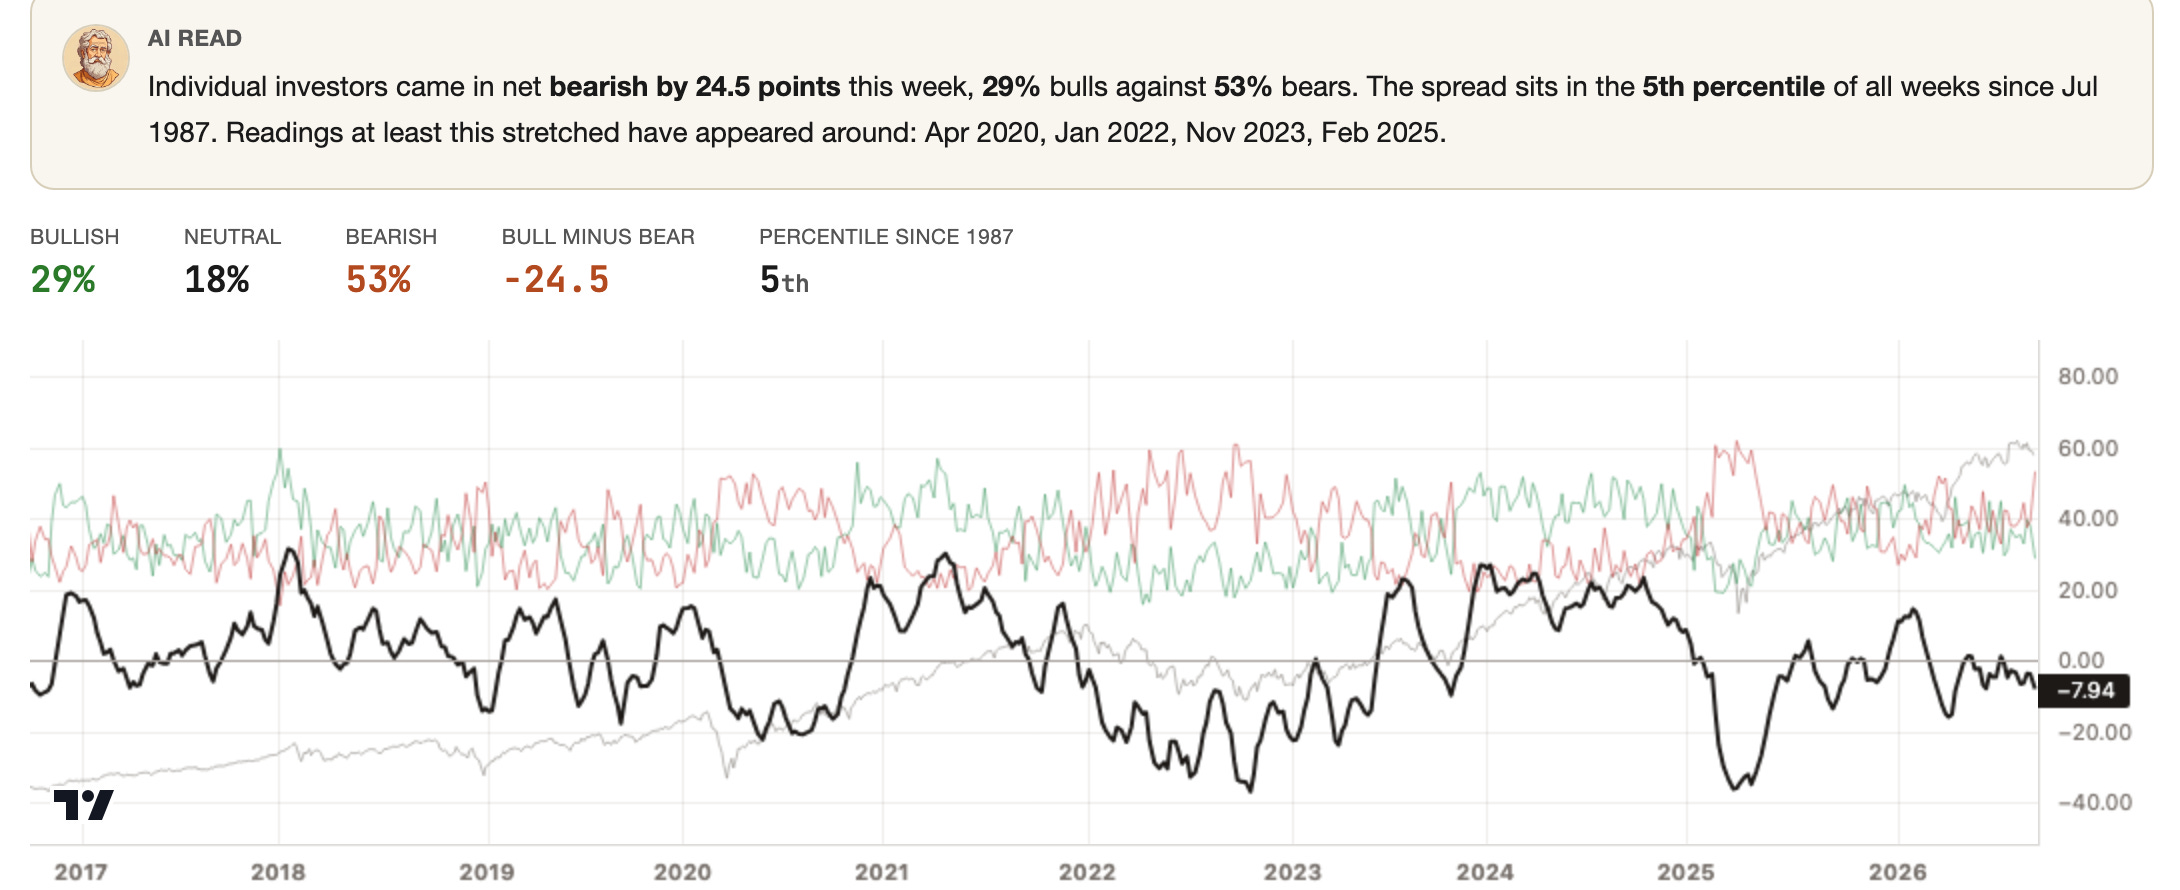
Individual investors already believe the break: 53% call themselves bearish in the AAII survey against 29% bulls, a gap more negative than in 95% of weeks since 1987, and the hedge funds’ futures books are net short 341,000 E-mini contracts. That much fear with the index 1.9% from its record is fuel for the relief case and confirmation for the grind case at the same time.
Grind, 45%. A flat index over falling members, for a fourth week. SPY stays inside 753 to 770, new lows run above 300 a day and the health score stays under 20. The tell is a SPY that holds 753 while the share of stocks above the 50-day fails to reclaim 35%.
The break, 30%. Two closes under 753, then under Wednesday’s 749.60, with dealers short gamma selling into it. The trigger is the 10-year back above 5% into Micron’s report on September 30 or the Fed on October 28.
Relief, 25%. Bears at 53%, the VIX at 14.8, VIX calls near the cheapest rank of the year, and dealers who chase rallies as hard as declines. That takes SPY through 770 toward the August 13 record at 777.88. It only counts if the members come: three sessions of equal-weight over cap-weight and 40% of stocks back above their 50-day.
🔥 Trade of the Week:
SDRL owns drillships and rents them to oil companies on contracts that run for years, so it is paid by the contract, not by Friday’s barrel. The tankers got the headline this week but the part of energy that has not run is the rigs. Oil and gas drilling moved from 21st to 14th of the 120 industries I track in a month and Seadrill sits 14% under its May high. Transocean agreed in February to pay $5.8 billion in stock for Valaris, so the rig owners are buying each other while the rigs are scarce.
The second quarter, reported August 10, is why the group re-rated. Revenue was $449 million, adjusted EBITDA $144 million, and the fleet was working 95.5% of the time. Seadrill raised its 2026 outlook for the second time, to $420 to $450 million of EBITDA from $370 to $420 million, added about $200 million of backlog since May and holds $2.9 billion of contracted work against $390 million of net debt. It bought back about $20 million of stock in the quarter and extended the program to December 31. 9 analysts cover it with an average target of $53.33, 12% above Friday’s close of $47.49, and the filings dated August 14 show AQR up 32.6% and Two Sigma opening a position, while Adage cut 43.8% and Balyasny 71.1%. The quants added, the macro funds left, and the stock went nowhere over 20 sessions, down 0.8%.
My Pullback screener has flagged it every session since September 10.
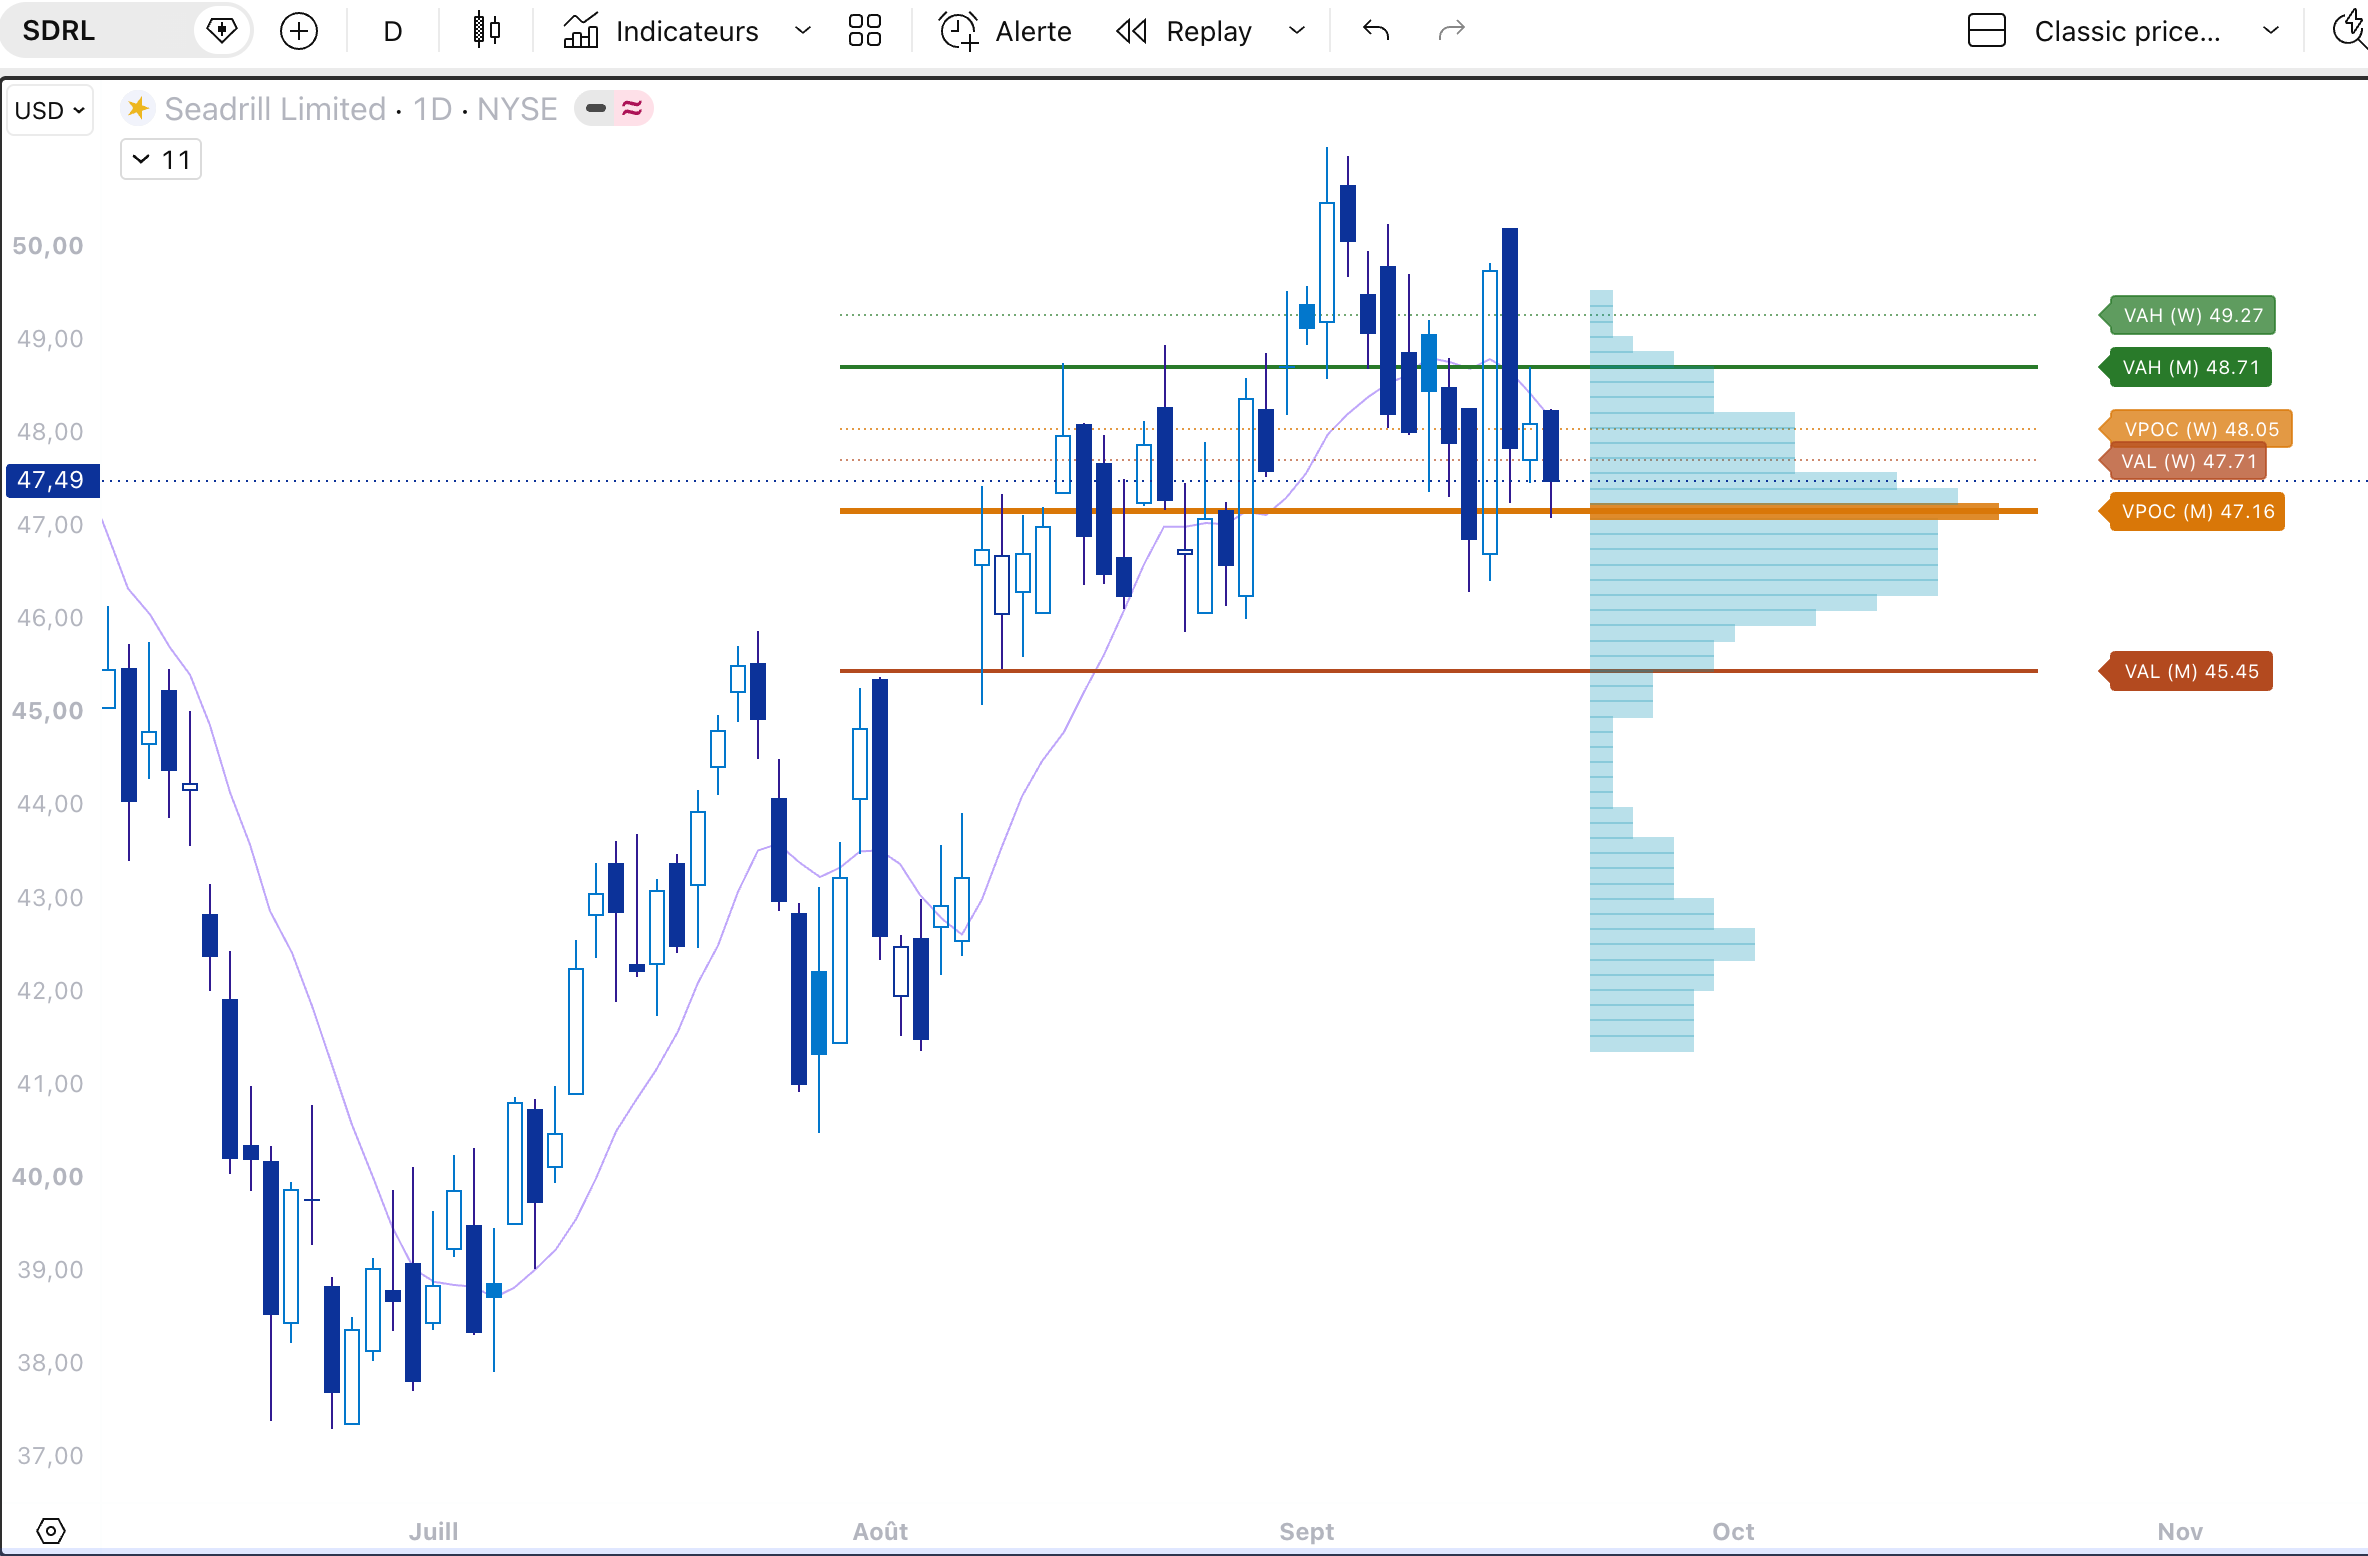
Since the start of August most of the volume traded between $45.45 and $48.71, with the busiest price at $47.16. Friday closed at $47.49, right on it.
The push to $51.08 on September 2 was sold within the week. The shares came back to the middle of that zone and have stayed there since.
So I buy inside the zone, in two halves. The first at $47.16, the busiest price since August. The second at $45.90, just above the bottom of where the shares changed hands.
Below $45.45 the volume is thin down to the August 5 low at $41.37. A close under $45.00 means the rotation failed and I am out, and that exit will slip.
First target is the September 2 high at $51.08. Second is the May 20 high at $55.47, the last price the spring buyers accepted. From the first entry that is 1.8 times the risk to the first target and 3.9 times to the second.
What kills it is the same thing that kills the tankers: a ceasefire and a barrel back at $80.
Sizing: usual size, in two halves
Entry: $47.16 first half, $45.90 second half
Stop: a close under $45.00
Target 1: $51.08 · Target 2: $55.47
See you next week,
Daniel
P.S. The app is the daily version of what you just read, the same boards and screeners I run every morning before I trade. It now comes with a free 7-day trial.
Disclaimer
This newsletter is for educational and informational purposes only. It is not financial advice.
The content reflects personal opinions shared publicly as a journal. Trading stocks, options, futures, or any financial instrument involves significant risk. You can lose your entire investment. There is no guarantee of profit.
The author is not a registered investment advisor, broker, or financial professional with any regulatory authority including the SEC or CFTC. Always consult a licensed financial advisor before making any investment decisions.
By reading this newsletter, you accept full responsibility for your own trading and investment choices. Past performance does not guarantee future results. Markets are unpredictable.
Screenshots are courtesy of TradingView, VixCentral, and other platforms with which the author has no affiliation. Information shared may contain errors or become outdated quickly.
This content is the intellectual property of the author. Copying or redistributing without permission is prohibited.
By continuing to read, you acknowledge and accept these terms.
Tickers in this edition, with their free data pages: MU · SPX
Read the desk every week
Market analysis in plain English, plus the app that scans the whole US market for you.
Become a member Read the original on Substack ↗