Fear Moved to Bonds
Market Recap · September 27th 2026 · The Philosopher Investor
2026-09-27 · 14 min read · Originally published on Substack ↗

Hello my friends,
On Wednesday the 10-year Treasury yield jumped 15 basis points to 5.11%, the highest since 2007. It closed the week at 5.18%. The trigger was a September business survey that ran at its fastest pace since July 2021, with input costs pushed up by energy. The same day, Fed governor Michael Barr said more hikes are likely. Polymarket now prices the odds of another hike this year at 90.5%.
The Nasdaq-100 closed at a record on Tuesday and finished the week up 3.3%. The equal-weight S&P 500 lost 0.2%. The biggest bond funds, from Treasuries to junk, closed at 52-week lows, and since Wednesday no sector has a majority of its stocks above the 50-day average.
Oil fell on talks to reopen Hormuz and took the last sector that was still holding up with it. So the index now stands on chips and a few platforms, in the week the cost of money reached its highest level since 2007.
Let’s get to the recap of this week.

Get the app. Every subscriber gets this letter. Paid readers also get the app it is written on.
What is inside:
Twenty-six screeners. They run every night on 12,000+ US stocks: pullbacks, breakouts, bottoms, squeezes, insider clusters, unusual options flow.
Sectors and themes. Which corners of the market lead and which lag against the S&P, which way each one is turning, and twenty-six themes tracked basket by basket: AI agents, defense tech, drones, critical minerals, the power grid, fintech.
Where the market stands. Breadth, rates and inflation, the dollar and the curve, commodities, crypto, and the sentiment gauges, all rebuilt after every close.
Who is buying. 13F books from 100+ funds, activist stakes, Congress disclosures, insider clusters, buybacks, federal contracts.
Your desk. Build your watchlist, set your price alerts, analyze your positions, keep your trading journal, and size your next trade.
The Academy, our private trading course. 35 lessons that take you from reading a chart to sizing a trade and a guide to every page in the app.
Start your 7-day free trial. Then $20 a month or $200 a year.
📊 Market Health
The jump in yields hit most S&P 500 members, and the largest names rose through it.
A higher long yield lowers what future profits are worth today. It also raises the cost of every loan a company has to roll next year. Most members of the index borrow, and the ten largest sit on cash and sell the AI capacity everyone is buying. So the gap between the Nasdaq-100 and the equal-weight S&P 500, where each member counts the same, reached 3.5 points in five sessions.
One session made the week. The S&P 500 gained 1.49% on Monday, when AMD and Meta led the Nasdaq Composite to a record, and lost 0.27% over the four sessions after it. The NYSE Composite, about 2,800 stocks, closed Friday 3.7% under its August 14 high, in the week the Nasdaq-100 set a new one. A rally that lives in one session and one index belongs to a few names.
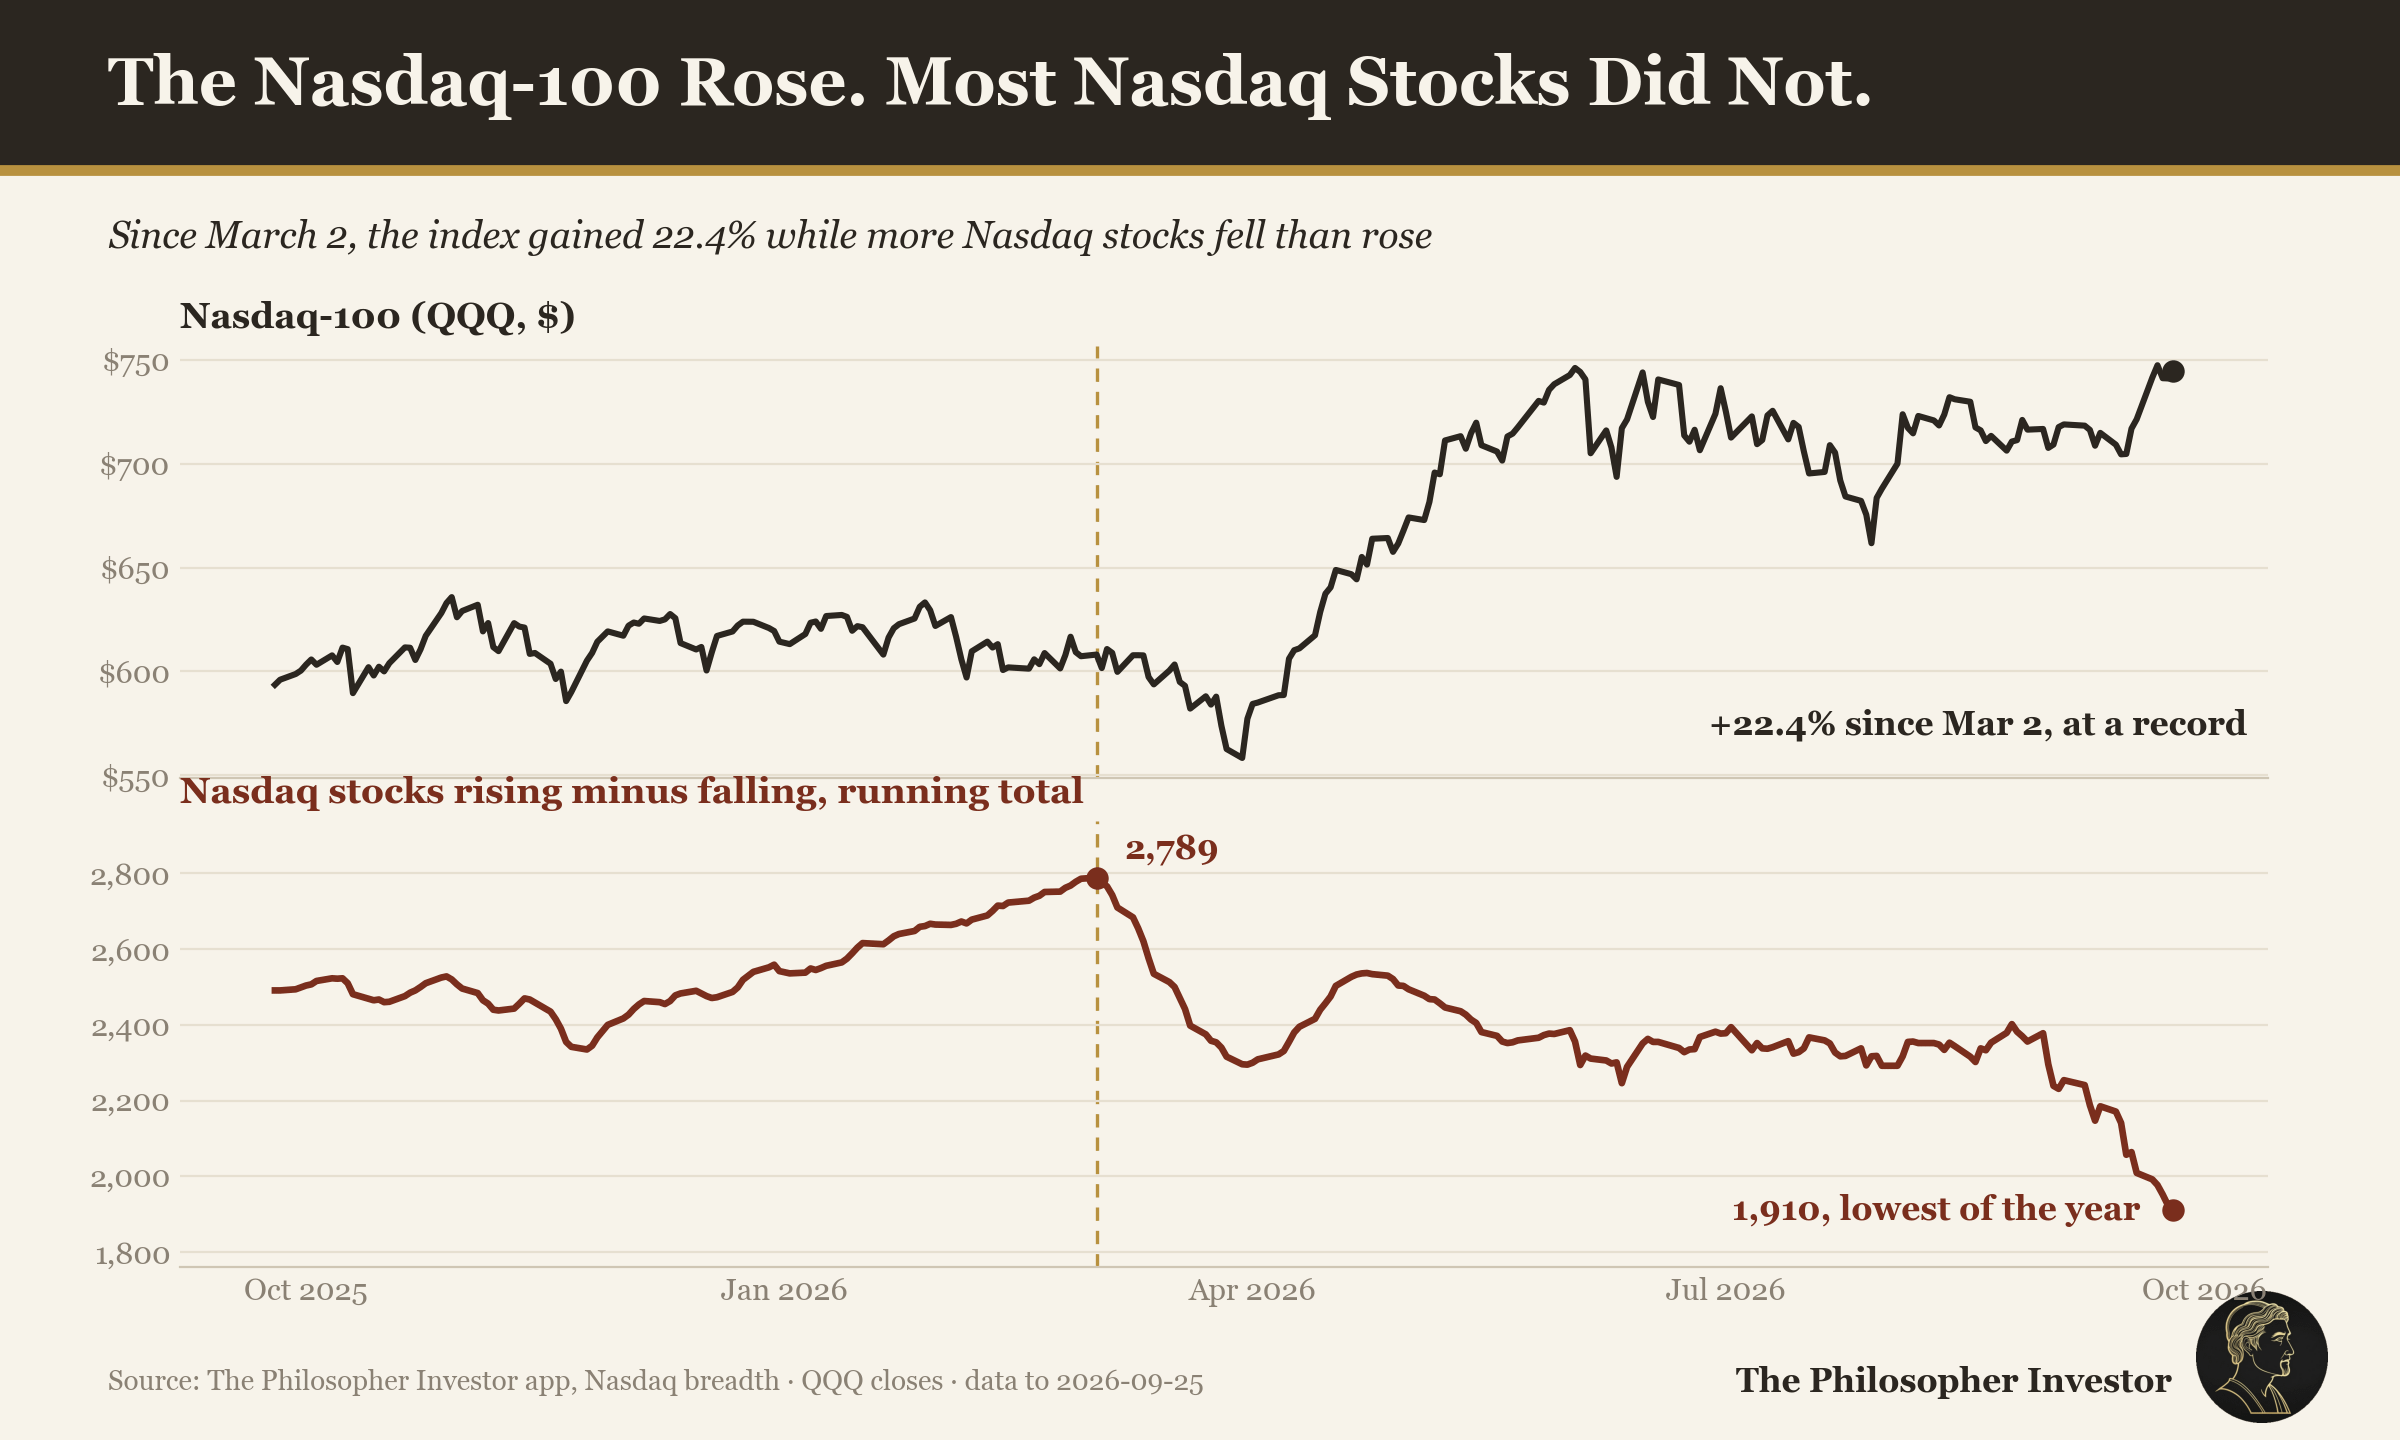
The Nasdaq’s own breadth says the same. Its running total of advancing minus declining stocks fell to 1,910 on Friday, the lowest point on the app’s twelve-month chart. A line that falls means more Nasdaq stocks fell than rose over the period, and the index rose anyway because its largest names did.
Only 28.8% of stocks hold above their 50-day average and 43.1% above their 200-day, and on Friday 300 names made a 52-week low against 146 highs. The list of lows includes TLT, IEF, AGG, BND, LQD and HYG, the bond funds that hold Treasuries, investment-grade debt and junk. When Treasuries and junk bonds make new lows together, the market is repricing money itself, and that reaches every stock priced on a multiple of future earnings.
The spark for the bond selling was a survey. On Wednesday S&P Global's flash reading of business activity for September came in at 58.4, the fastest expansion since July 2021, with services at 58.7 against 56.0 expected. Input costs rose with energy prices. An economy running that hot gives the Fed no reason to stop, so the 10-year rose 15 basis points that day, the 5-year closed above 5% on Thursday and the 30-year finished the week at 5.50%.
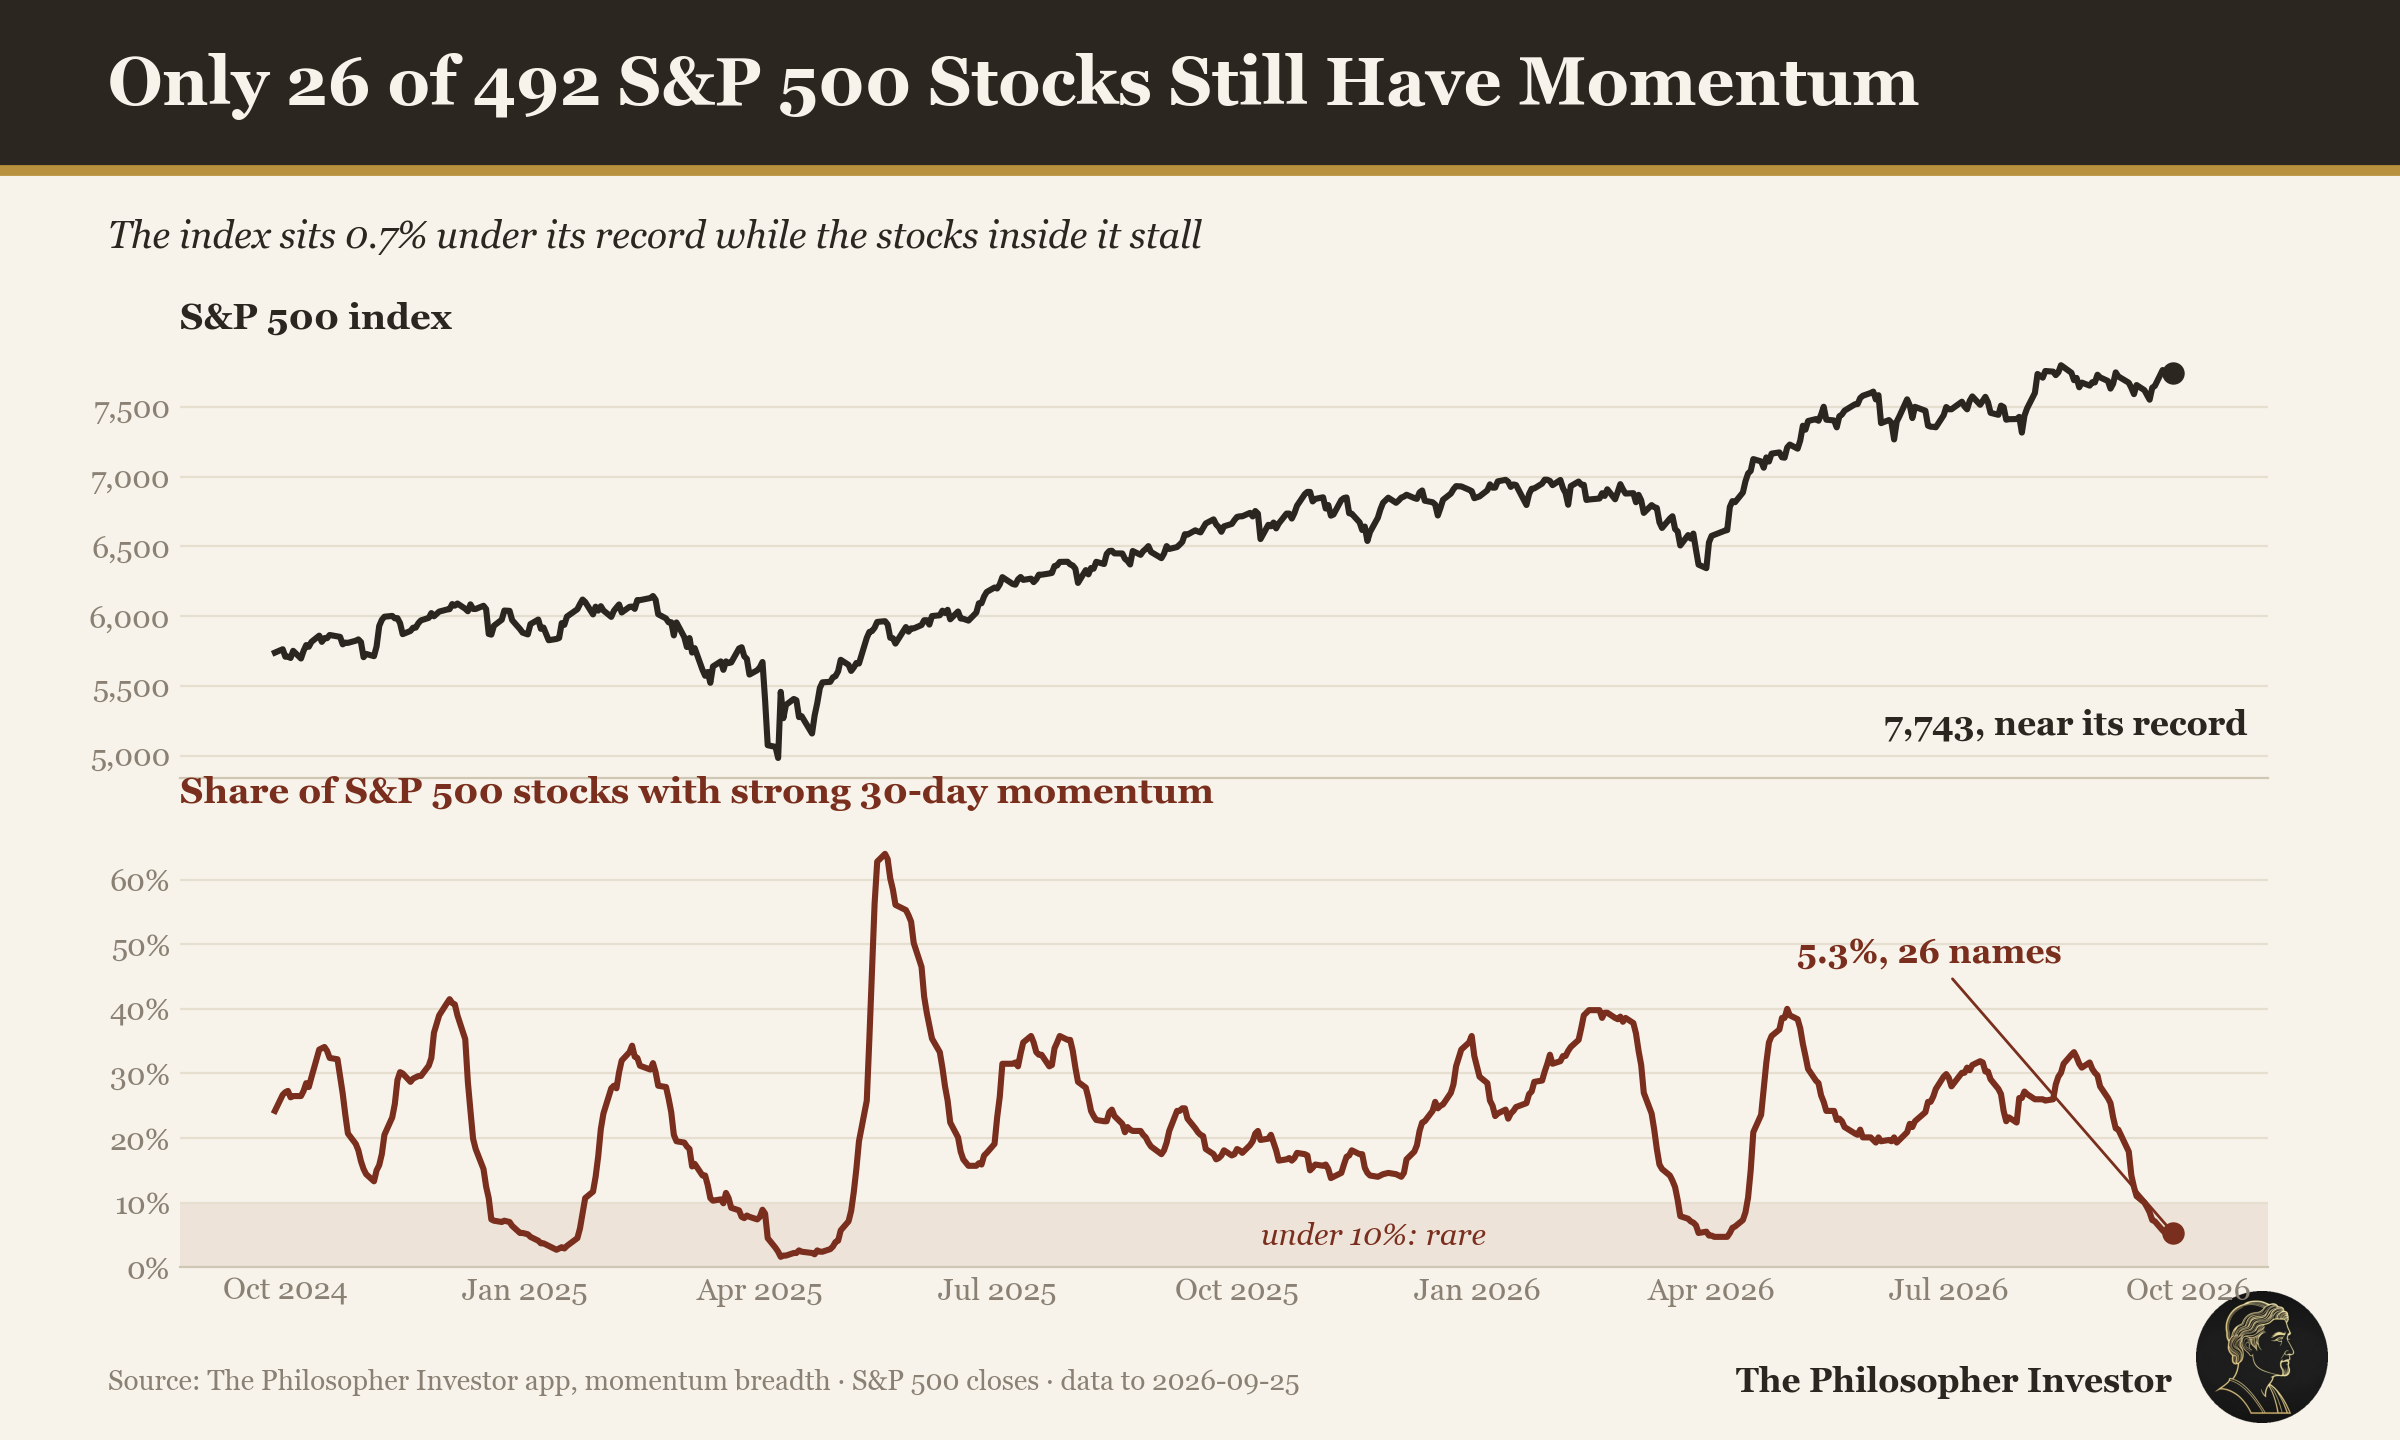
The momentum count shows how few names carry the index. On Friday, only 26 of 492 S&P 500 members still had strong 30-day momentum. On September 10 there were 61.
The weight of the ten largest companies shows the same thing from the top. They now make up 41.2% of the S&P 500's value, against 30.8% in January 2022, close to the 42.3% high of October 2025. The ten are Nvidia, Apple, Alphabet, Microsoft, Amazon, Broadcom, Meta, Tesla, Micron and Eli Lilly. With that much weight at the top, the index can hold its level while most of its members fall, which is what this week showed.
At today's prices, US stocks are priced to earn 4.8% a year over the long run. The 10-year Treasury pays 5.2% with the coupon guaranteed. That leaves an equity risk premium of -0.39%: an investor is paid less to own stocks than to lend to the government for ten years. The Shiller P/E, price against a decade of real earnings, sits at 40.9, against a median of 16.2 since 1871.
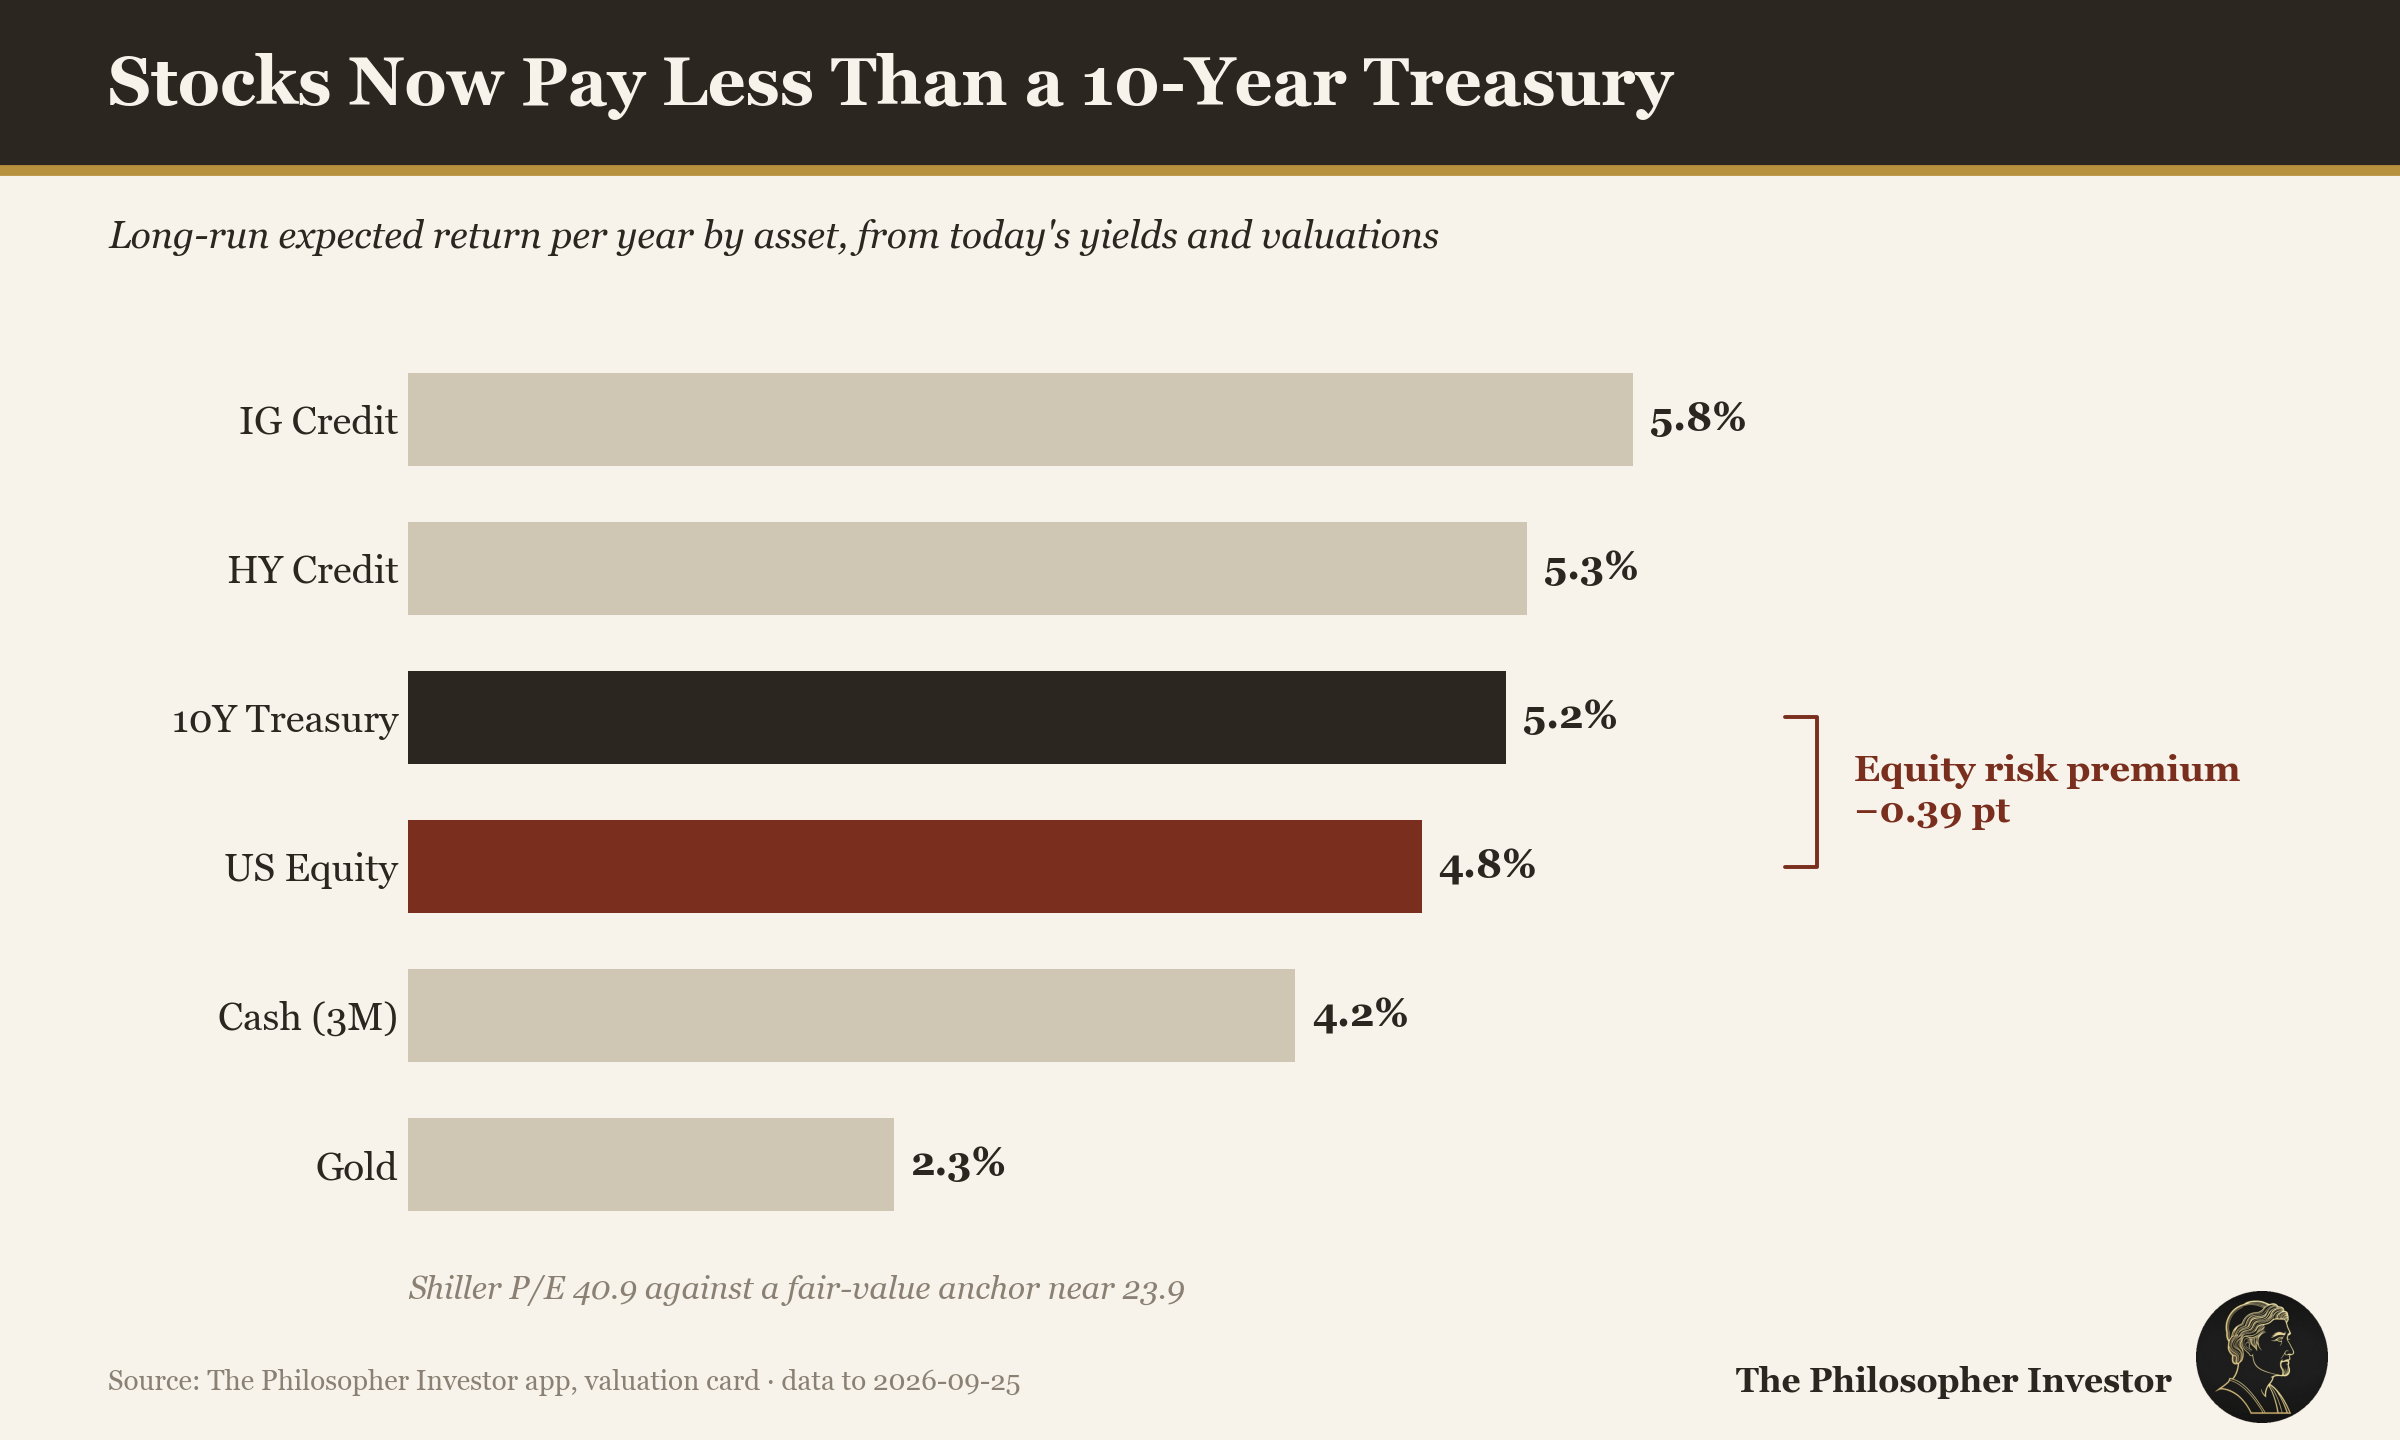
A negative premium times nothing, and expensive markets can stay expensive for years. It does mean each new basis point on the 10-year weakens the case for owning the median stock, which is what the breadth numbers show. And the Fed told us on Wednesday that it has more basis points in mind.

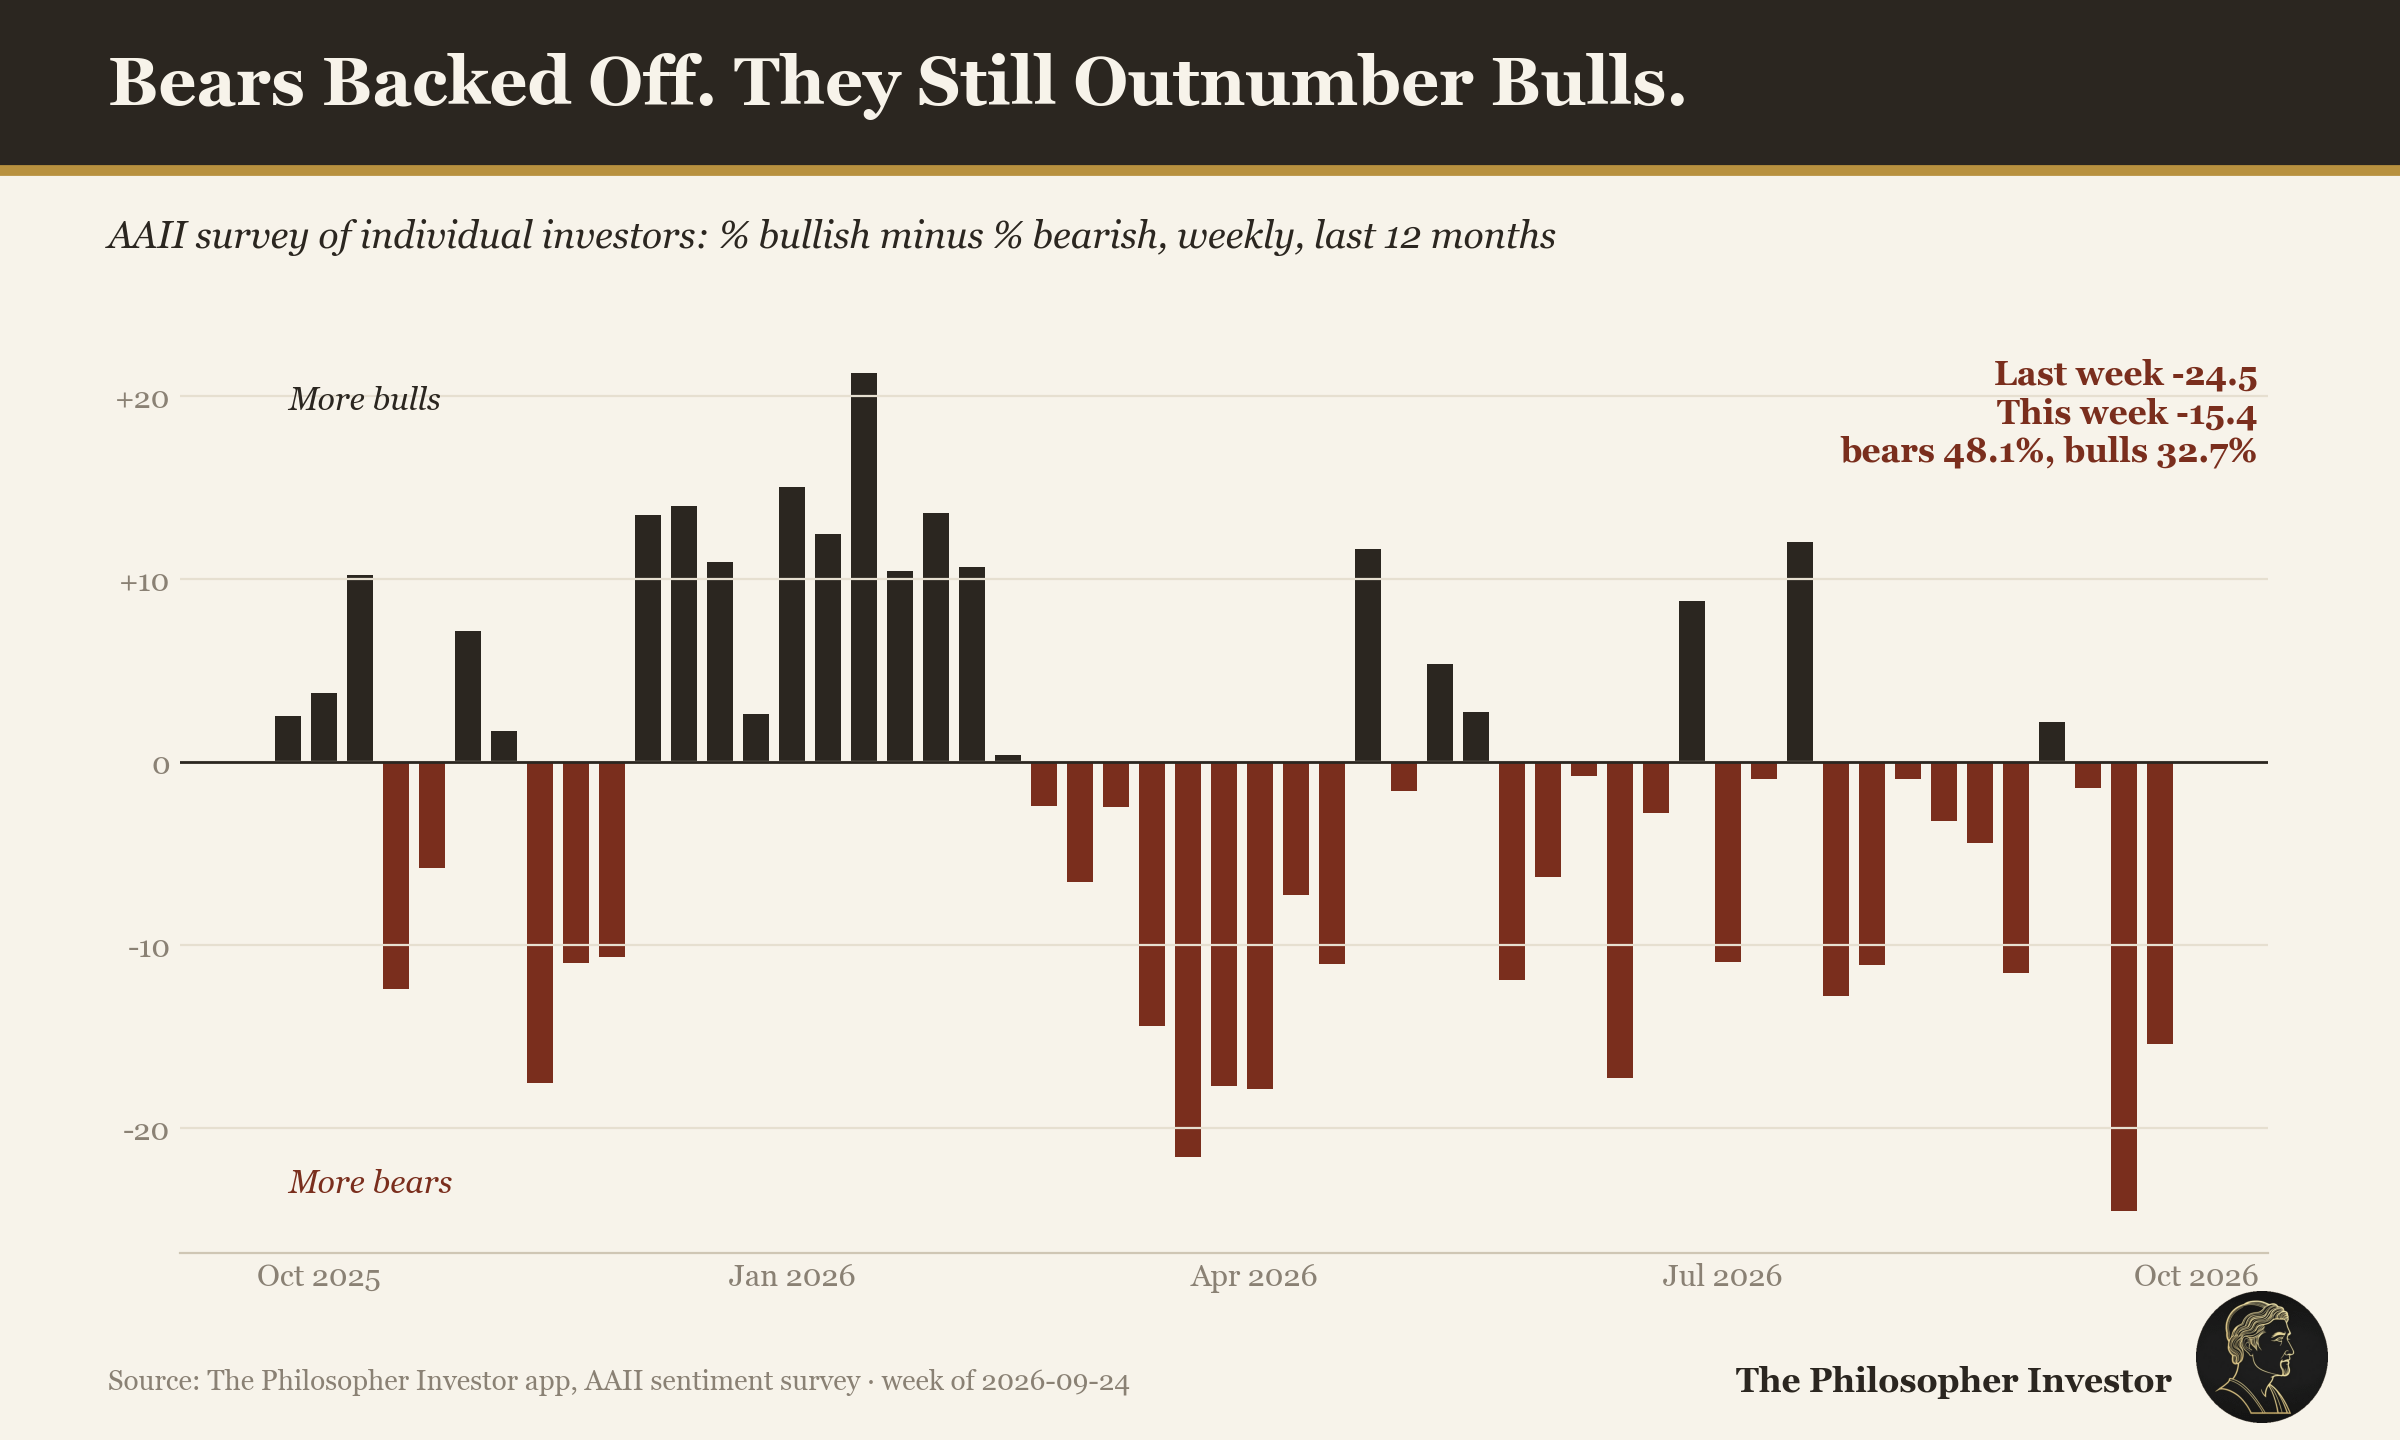
Individual investors are losing their fear too early. Bears in the AAII survey dropped from 53.3% to 48.1% and bulls climbed from 28.8% to 32.7%, all on a Nasdaq record carried by a handful of giants. Meanwhile 300 stocks sit at a 52-week low.
🚨 Sector Rotation
Since Wednesday, no sector has a majority of its stocks above the 50-day average.
Energy was the last one standing. A week ago 58.9% of its members were above trend, two weeks ago 80.7%. On Friday it was 27.9%. US and Iranian negotiators held indirect talks at the UN in New York, and Iran put forward a plan to reopen the Strait of Hormuz within seven days. WTI fell 7.8% to $92.44, with every close of the week under $100. Positioning was light going in: money managers held 102,000 net long WTI contracts on September 22, about a fifth of their January 2018 record of 484,000. So the drop came from the news, and a failed deal would find few sellers left.
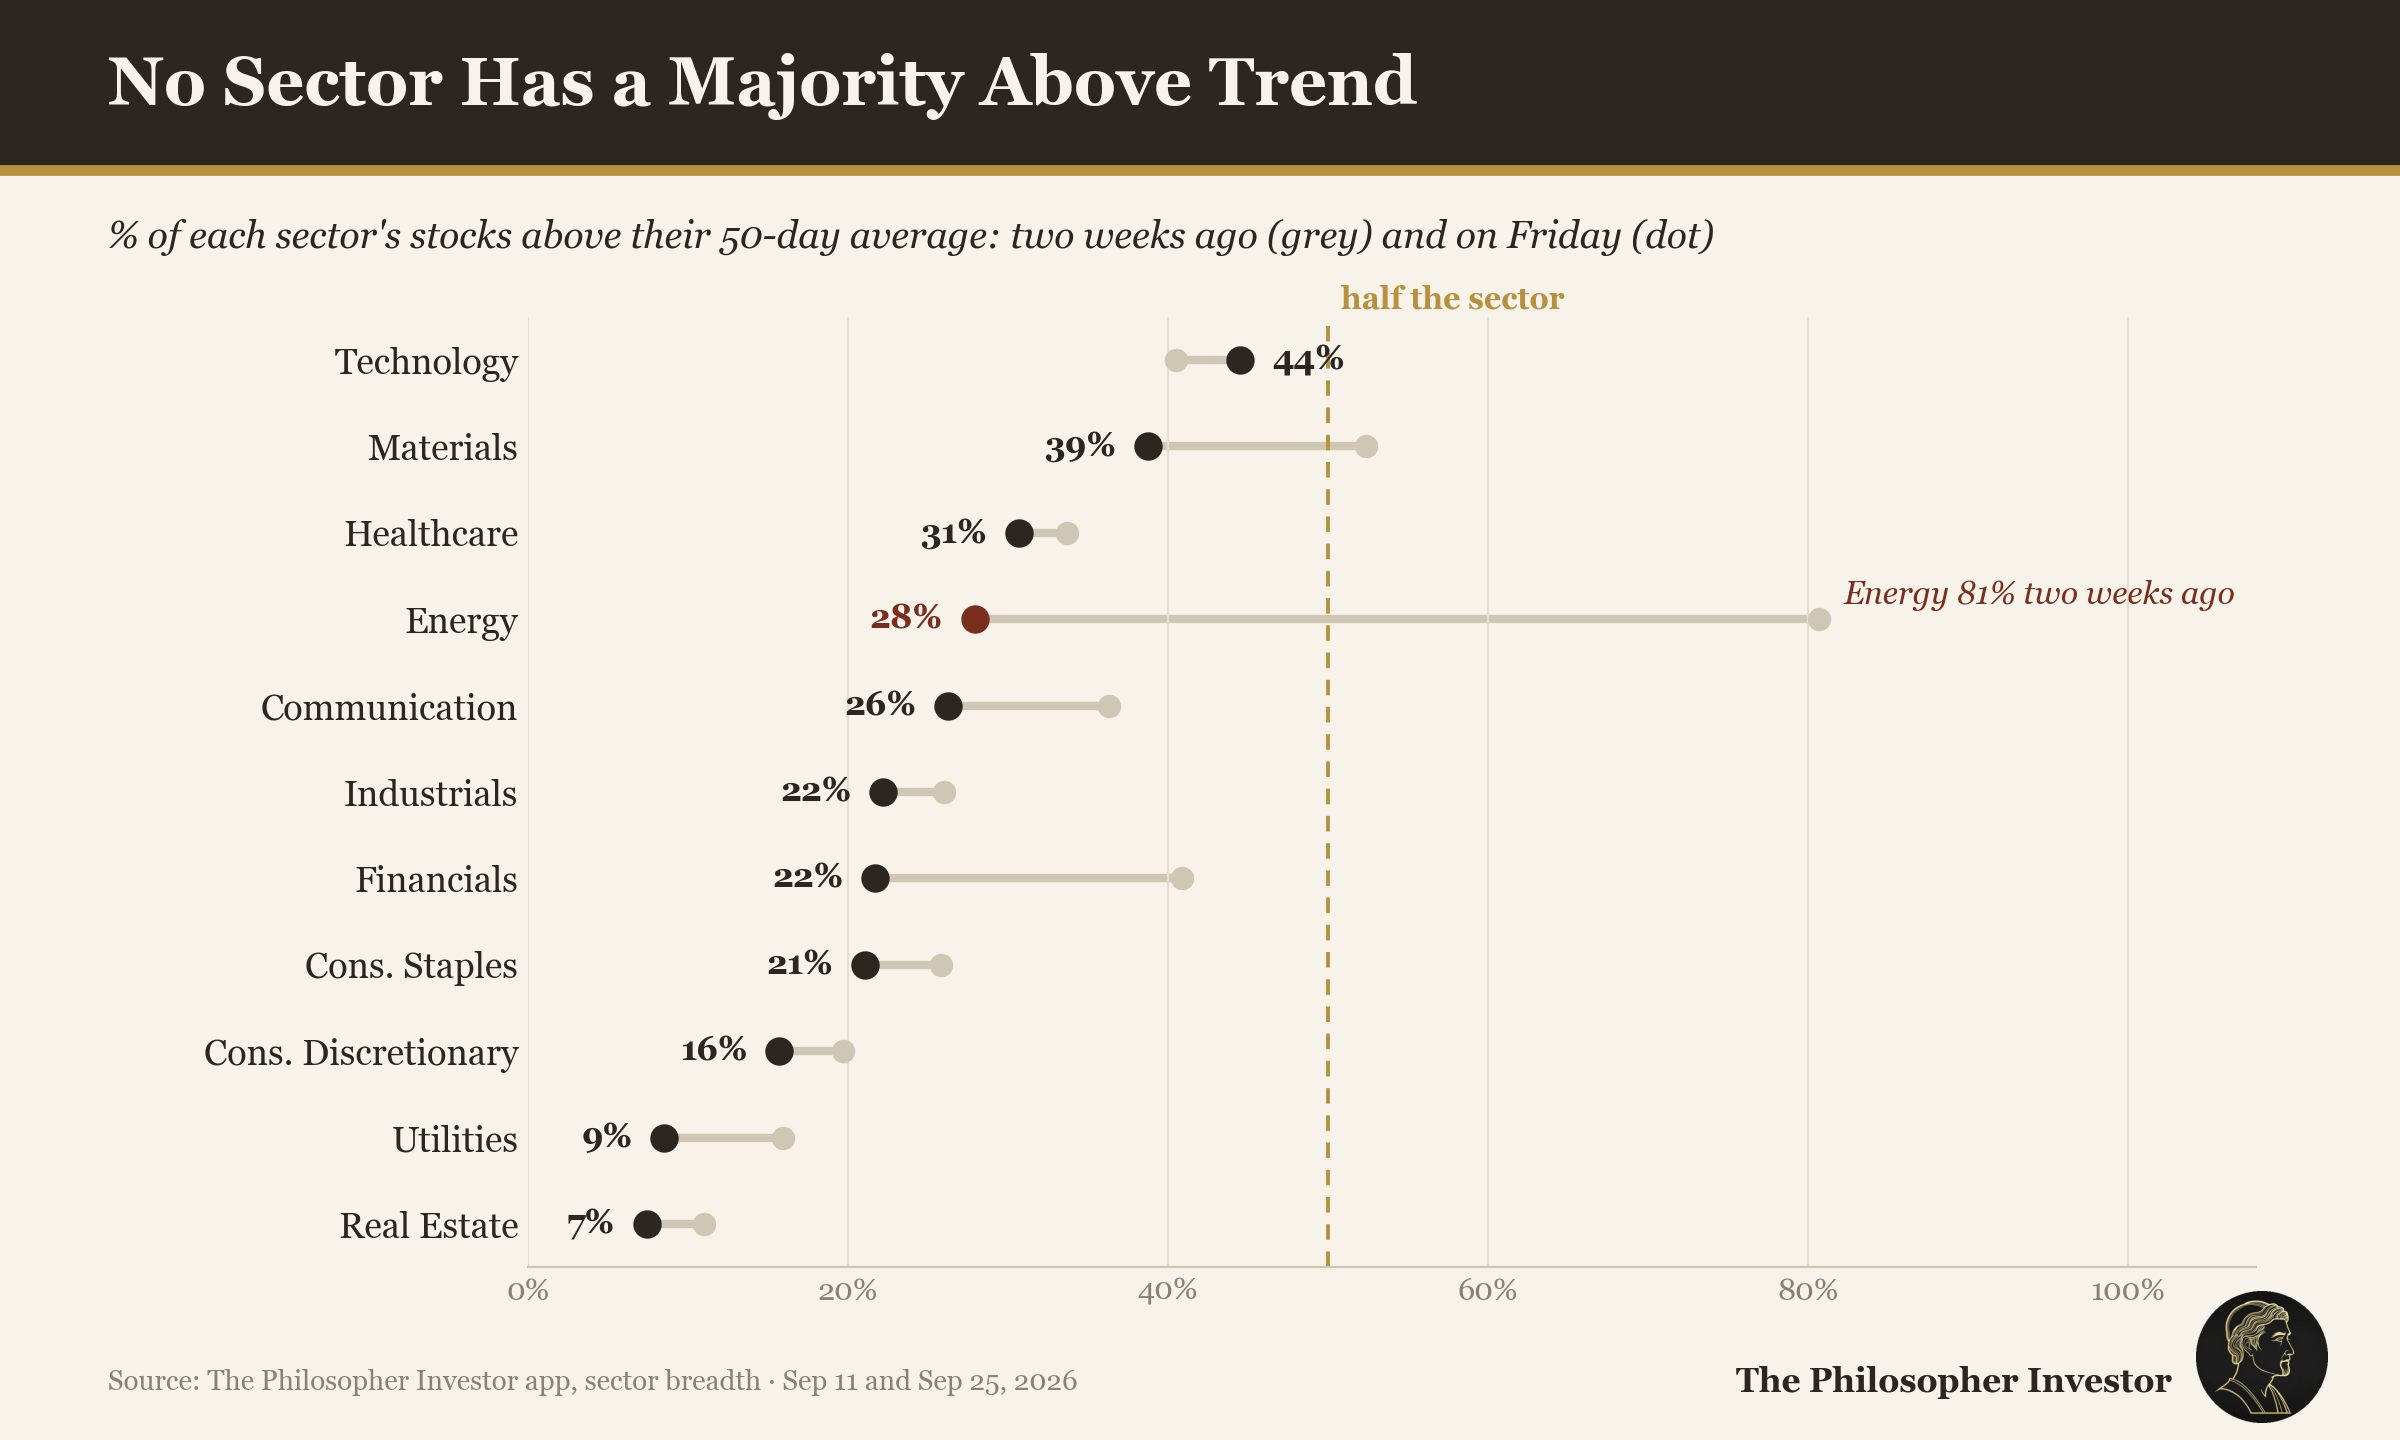
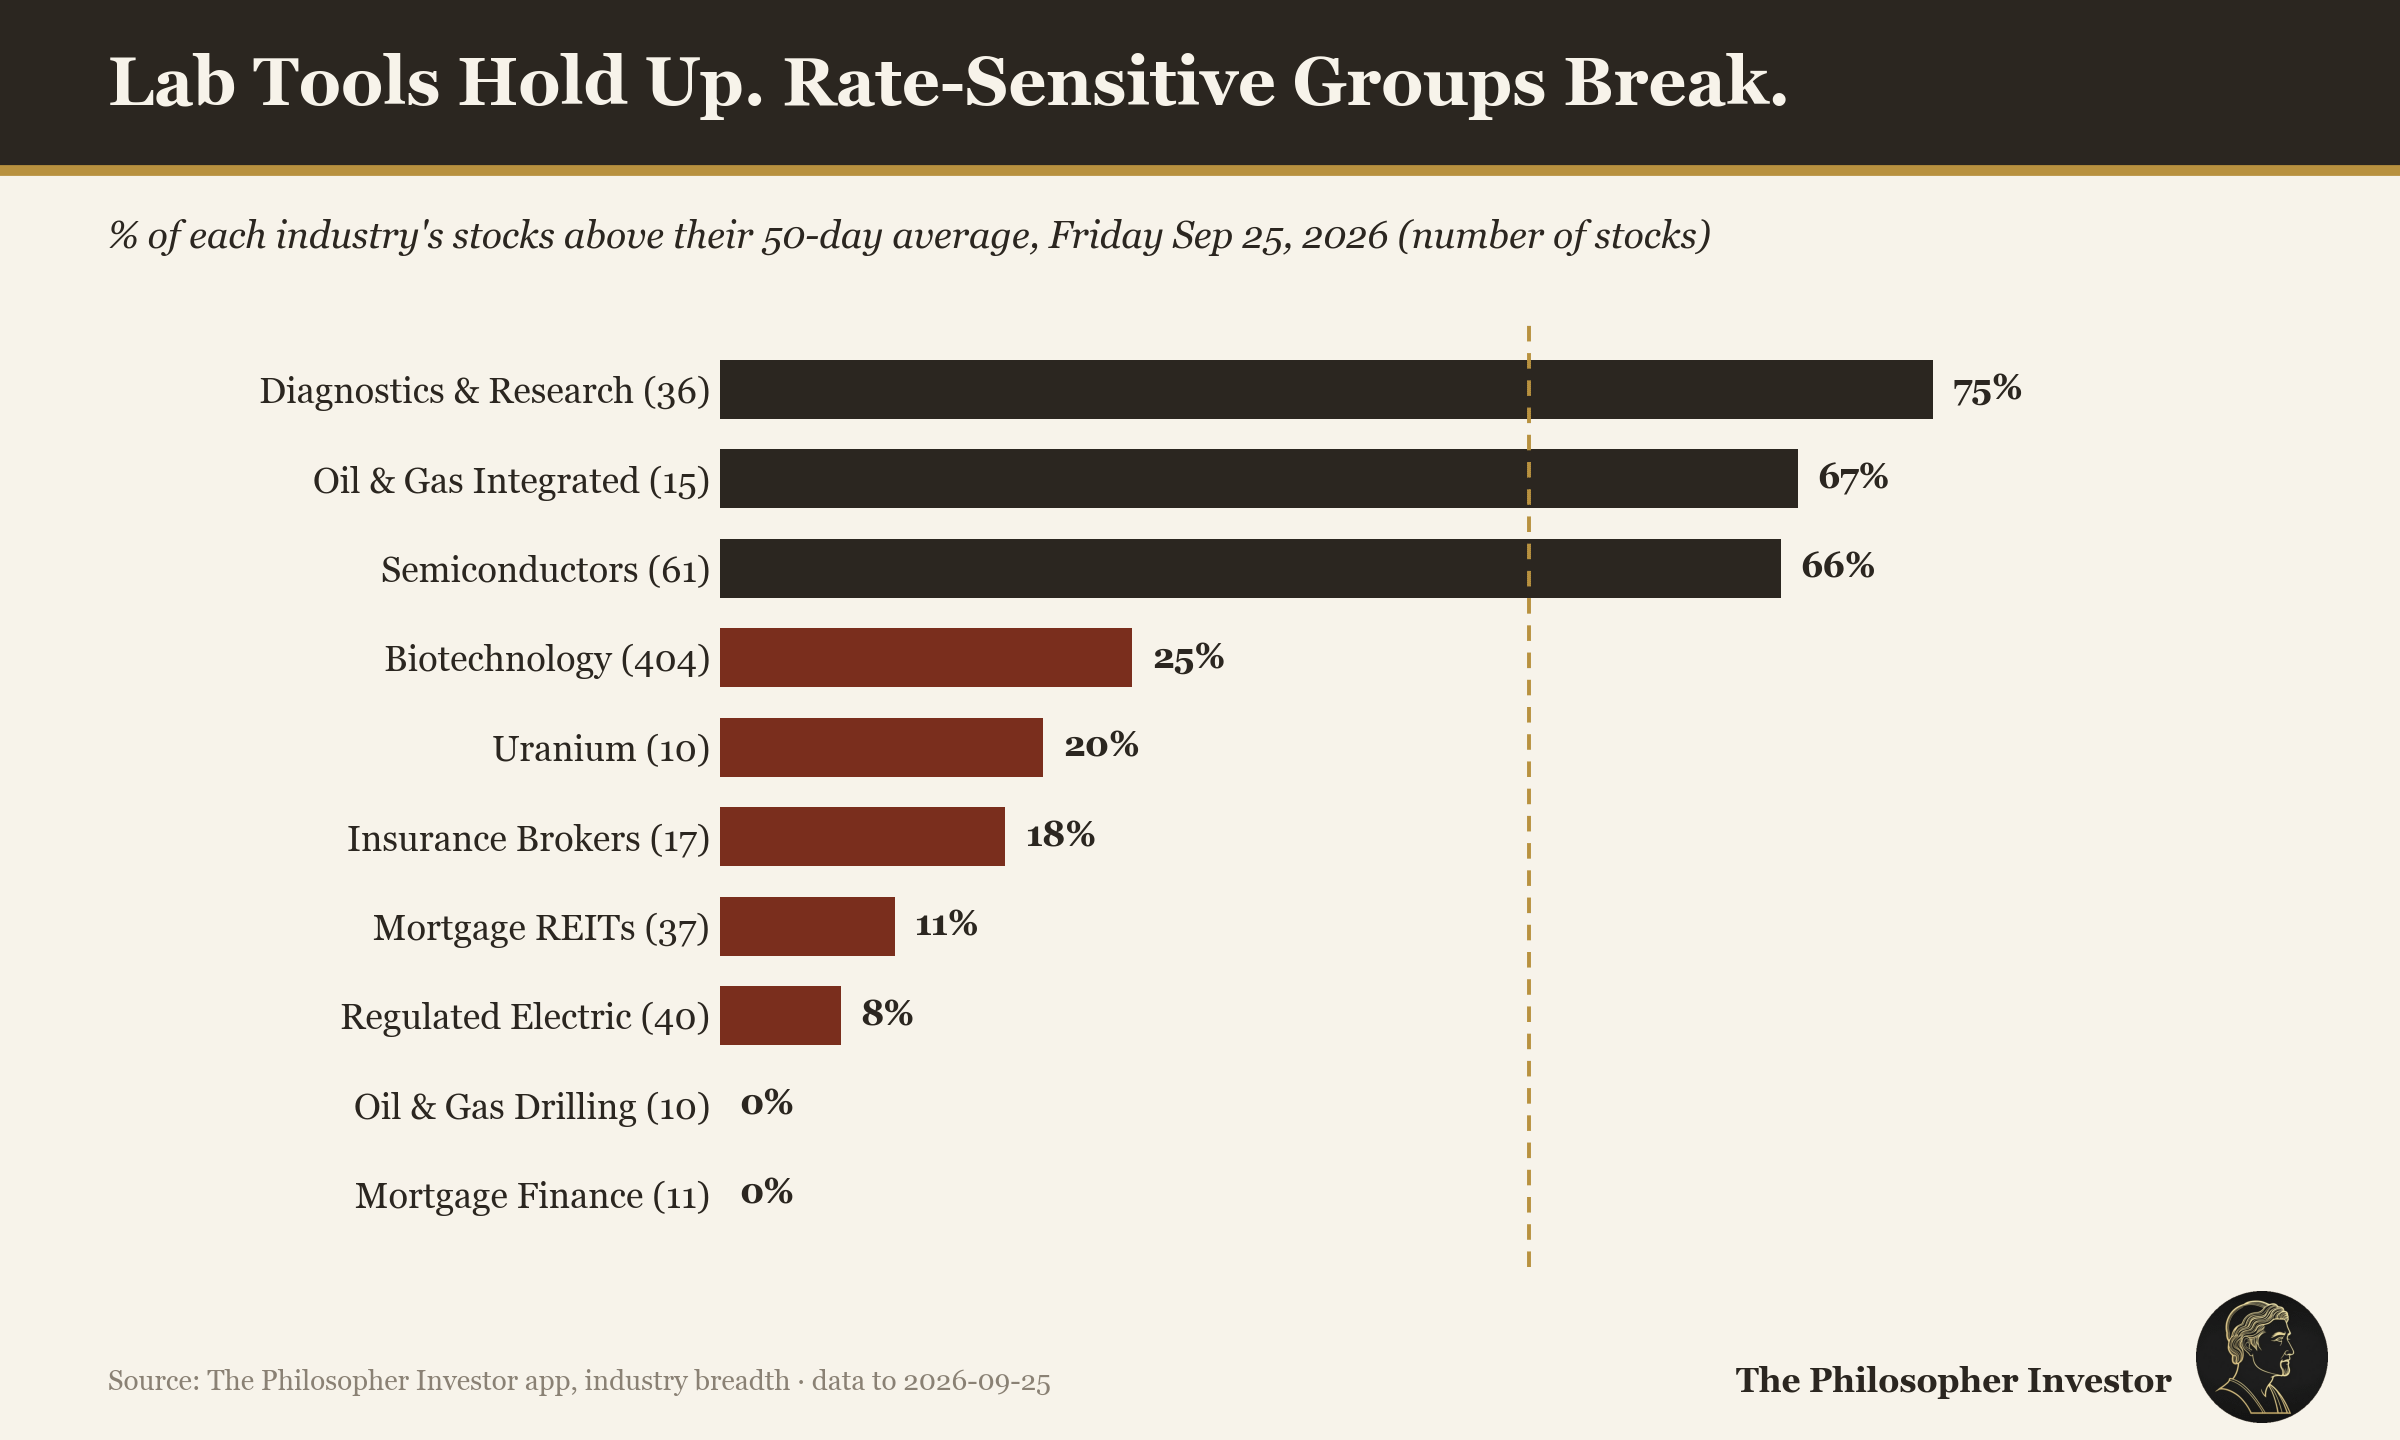
Two weeks ago I called energy a bet on a strait that stays shut. This week the market priced a strait that could open, and it sold the barrel, the refiner and the boat together: Valero -6.3%, Marathon Petroleum -7.4%, Frontline -7.2%. In oil and gas drilling, 80% of the names were above their 50-day average a week ago and none of them are now. The sector that offset the damage from rates has stopped offsetting it. The majors held better: 67% of integrated oil companies still trade above their 50-day average, Exxon lost 1.8% and Chevron 2.4%. They earn on the whole chain, from the well to the pump, and a lower barrel costs them less than it costs a driller.
Chips took its place. The share of semiconductor stocks above their 50-day average went from 41% to 66% in a week, and the SOXX semiconductor ETF gained 7.4%. AMD rose 12.7% and crossed $1 trillion in market value on Monday. Meta gained 11.3% the same day after Wells Fargo raised its target, and 12.9% on the week. Communications rose 1.9% on the week, and Meta did most of the work: Alphabet lost 1.6% and Netflix 0.9%.
Technology is now the strongest sector, with 44.5% of its members above trend. That is still under half, and it is enough to lift the index because the names that rose are the largest ones. Strong 30-day momentum now survives mainly in two sectors of the S&P 500, 14.5% of technology names and 14.3% of energy names. In utilities, staples, real estate and materials, not one member has it.
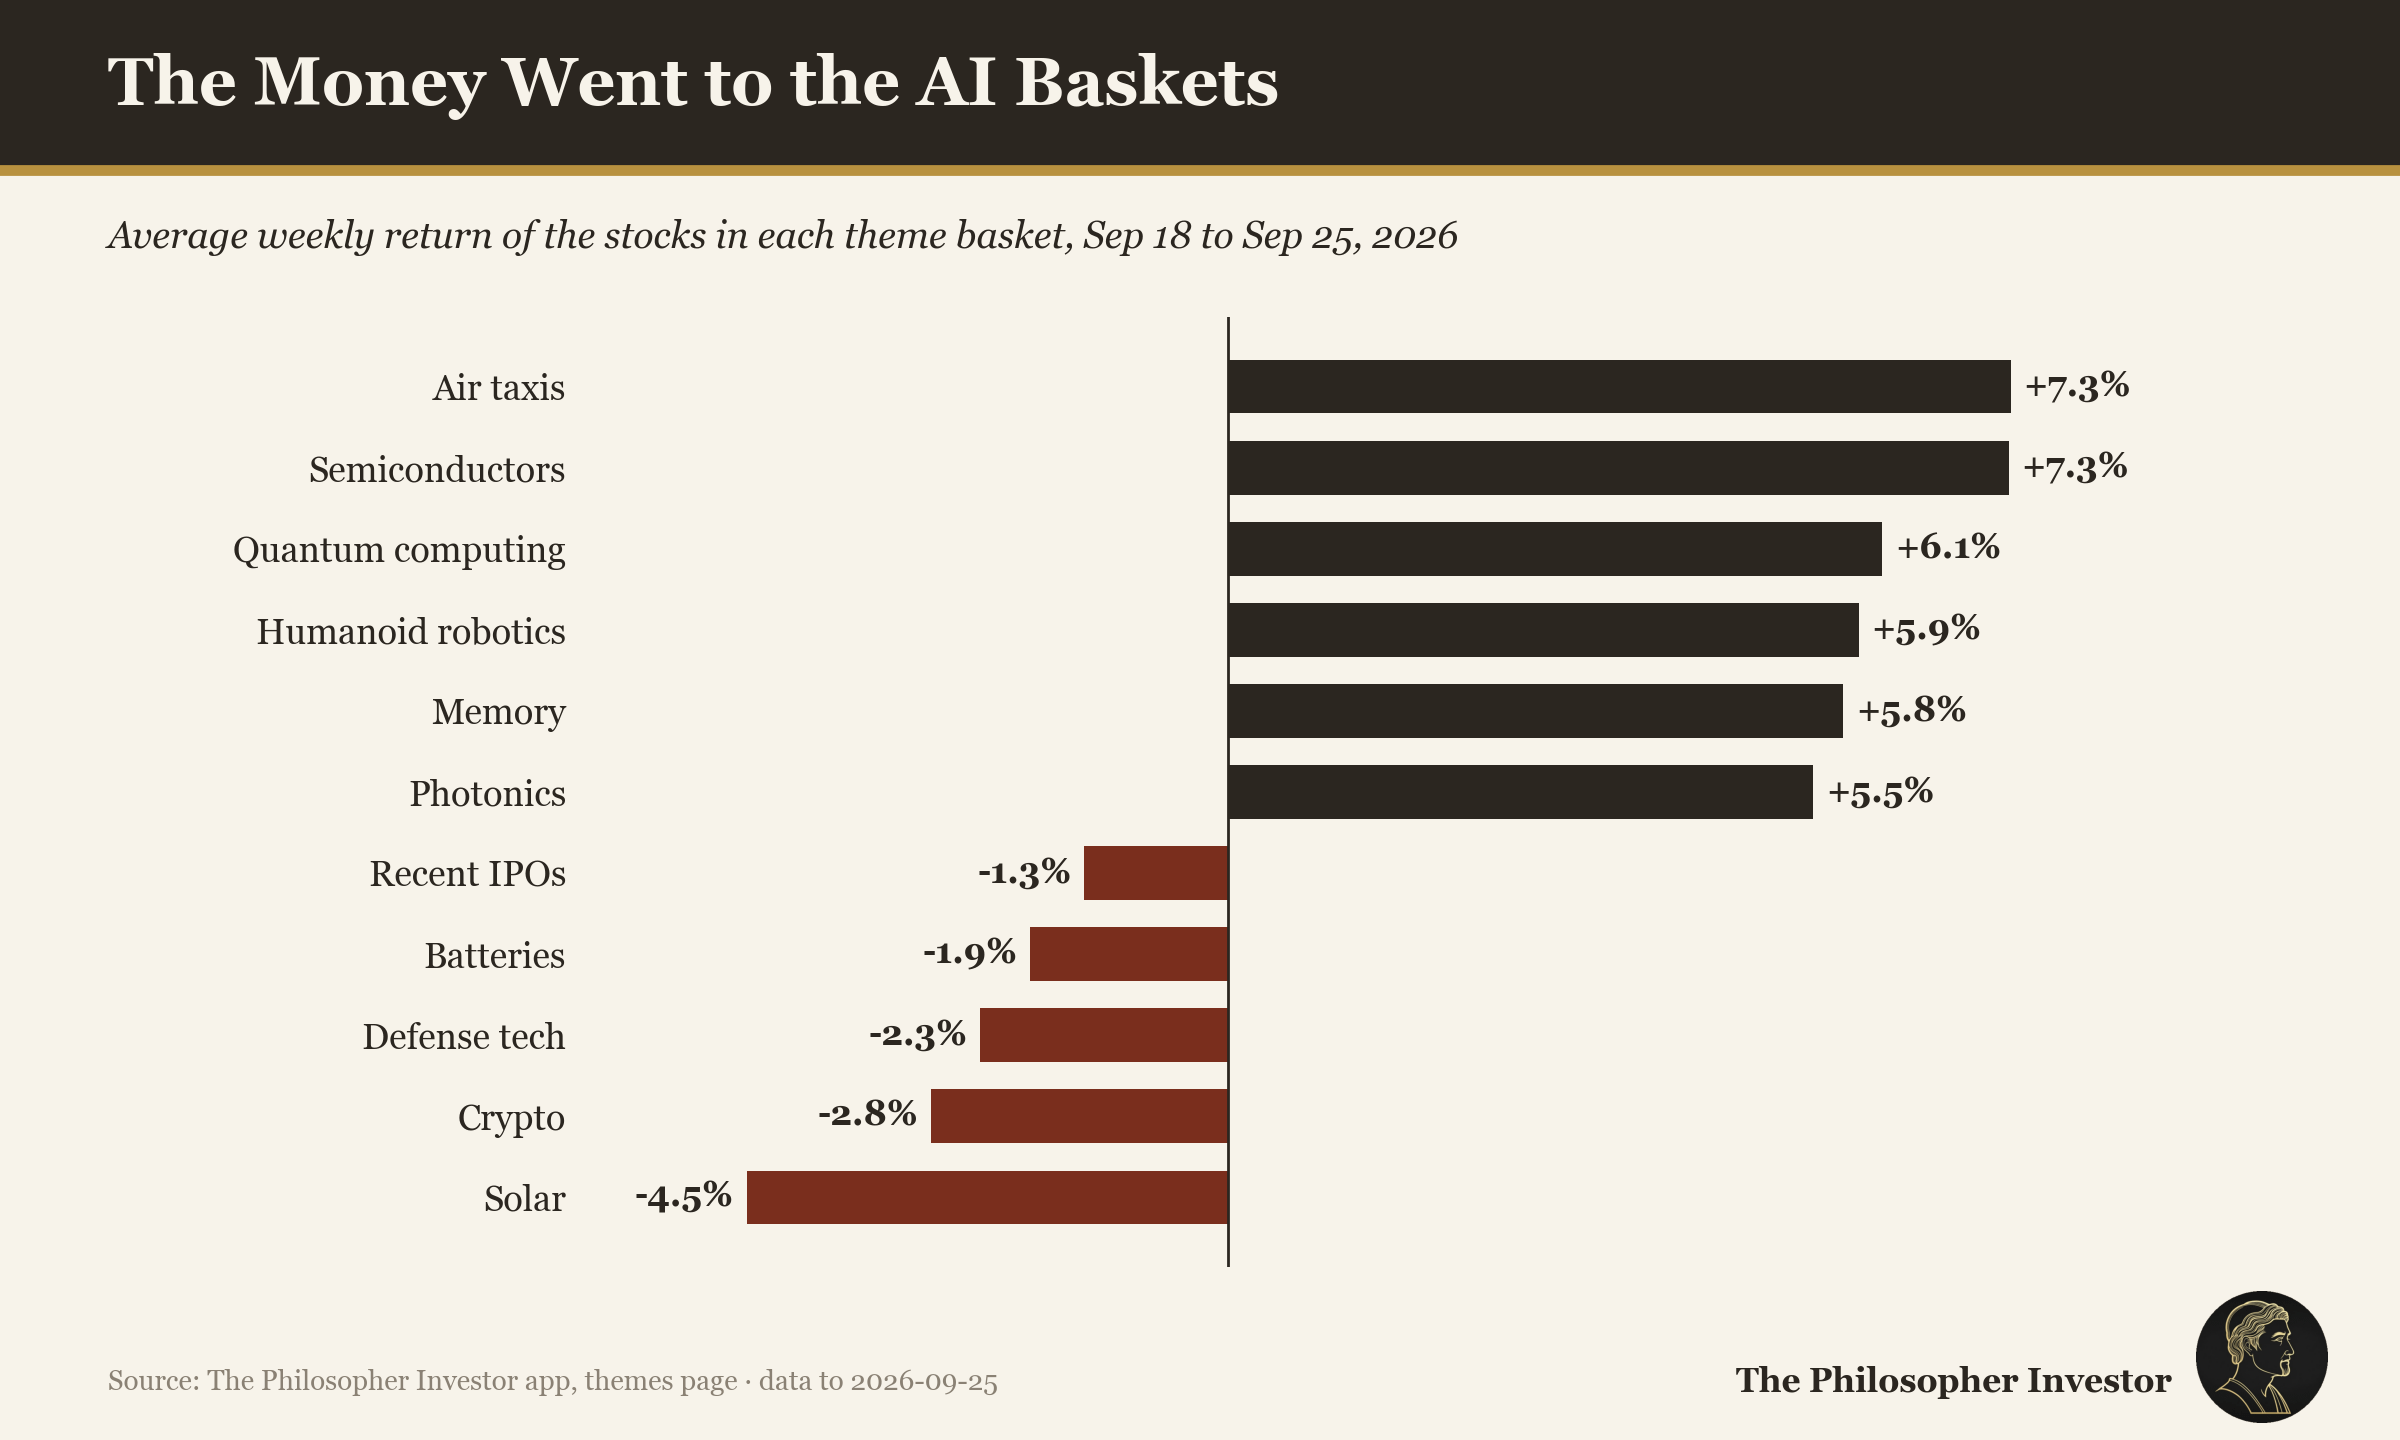
The themes page tells the same story basket by basket. Semiconductors gained 7.3% on the week, quantum computing 6.1%, humanoid robotics 5.9% and memory 5.8%. Solar lost 4.5% and defense tech 2.3%. The money went to the AI baskets and left solar, a business that runs on cheap financing, in the week financing got more expensive.
At the other end sit the groups priced off the 10-year. Utilities lost 3.9% and only 8.5% of their members hold above trend. Mortgage REITs and regulated electric utilities lead the list of new lows. In mortgage finance, not one of the 11 stocks I track holds above its 50-day average. A utility pays a dividend that competes with the Treasury coupon, so each basis point on the 10-year makes it less worth owning.
The weakest industries over 20 sessions are uranium, mortgage finance, insurance brokers, biotechnology and precious metals miners. Most of that list lives on the price of money. A mortgage lender funds itself at that price, and a biotech discounts cash flows that sit years away with it.
One group outside AI keeps making highs. Diagnostics & Research leads the new-highs list, and 75% of the 36 names in that industry hold above their 50-day average. The lab-equipment move I could not explain a week ago kept going: Danaher gained 6.0%. I still have no news story for it, and a move this steady in a group this broad usually has a buyer with a reason. Inside health care the split is sharp. Biotechnology, 404 names, has only 25% above trend and trails the S&P 500 by 13.9 points over 20 sessions. The buyer pays for the tools and sells the drug bets.
📉 Volatility
Fear moved to the bond market this week, and stock options barely noticed.
The MOVE index measures how much traders expect Treasury prices to swing. It went from 80.6 to 104.6 on Thursday and closed the week at 96.0. The VIX, the same measure for the S&P 500, went from 14.81 to 14.87.
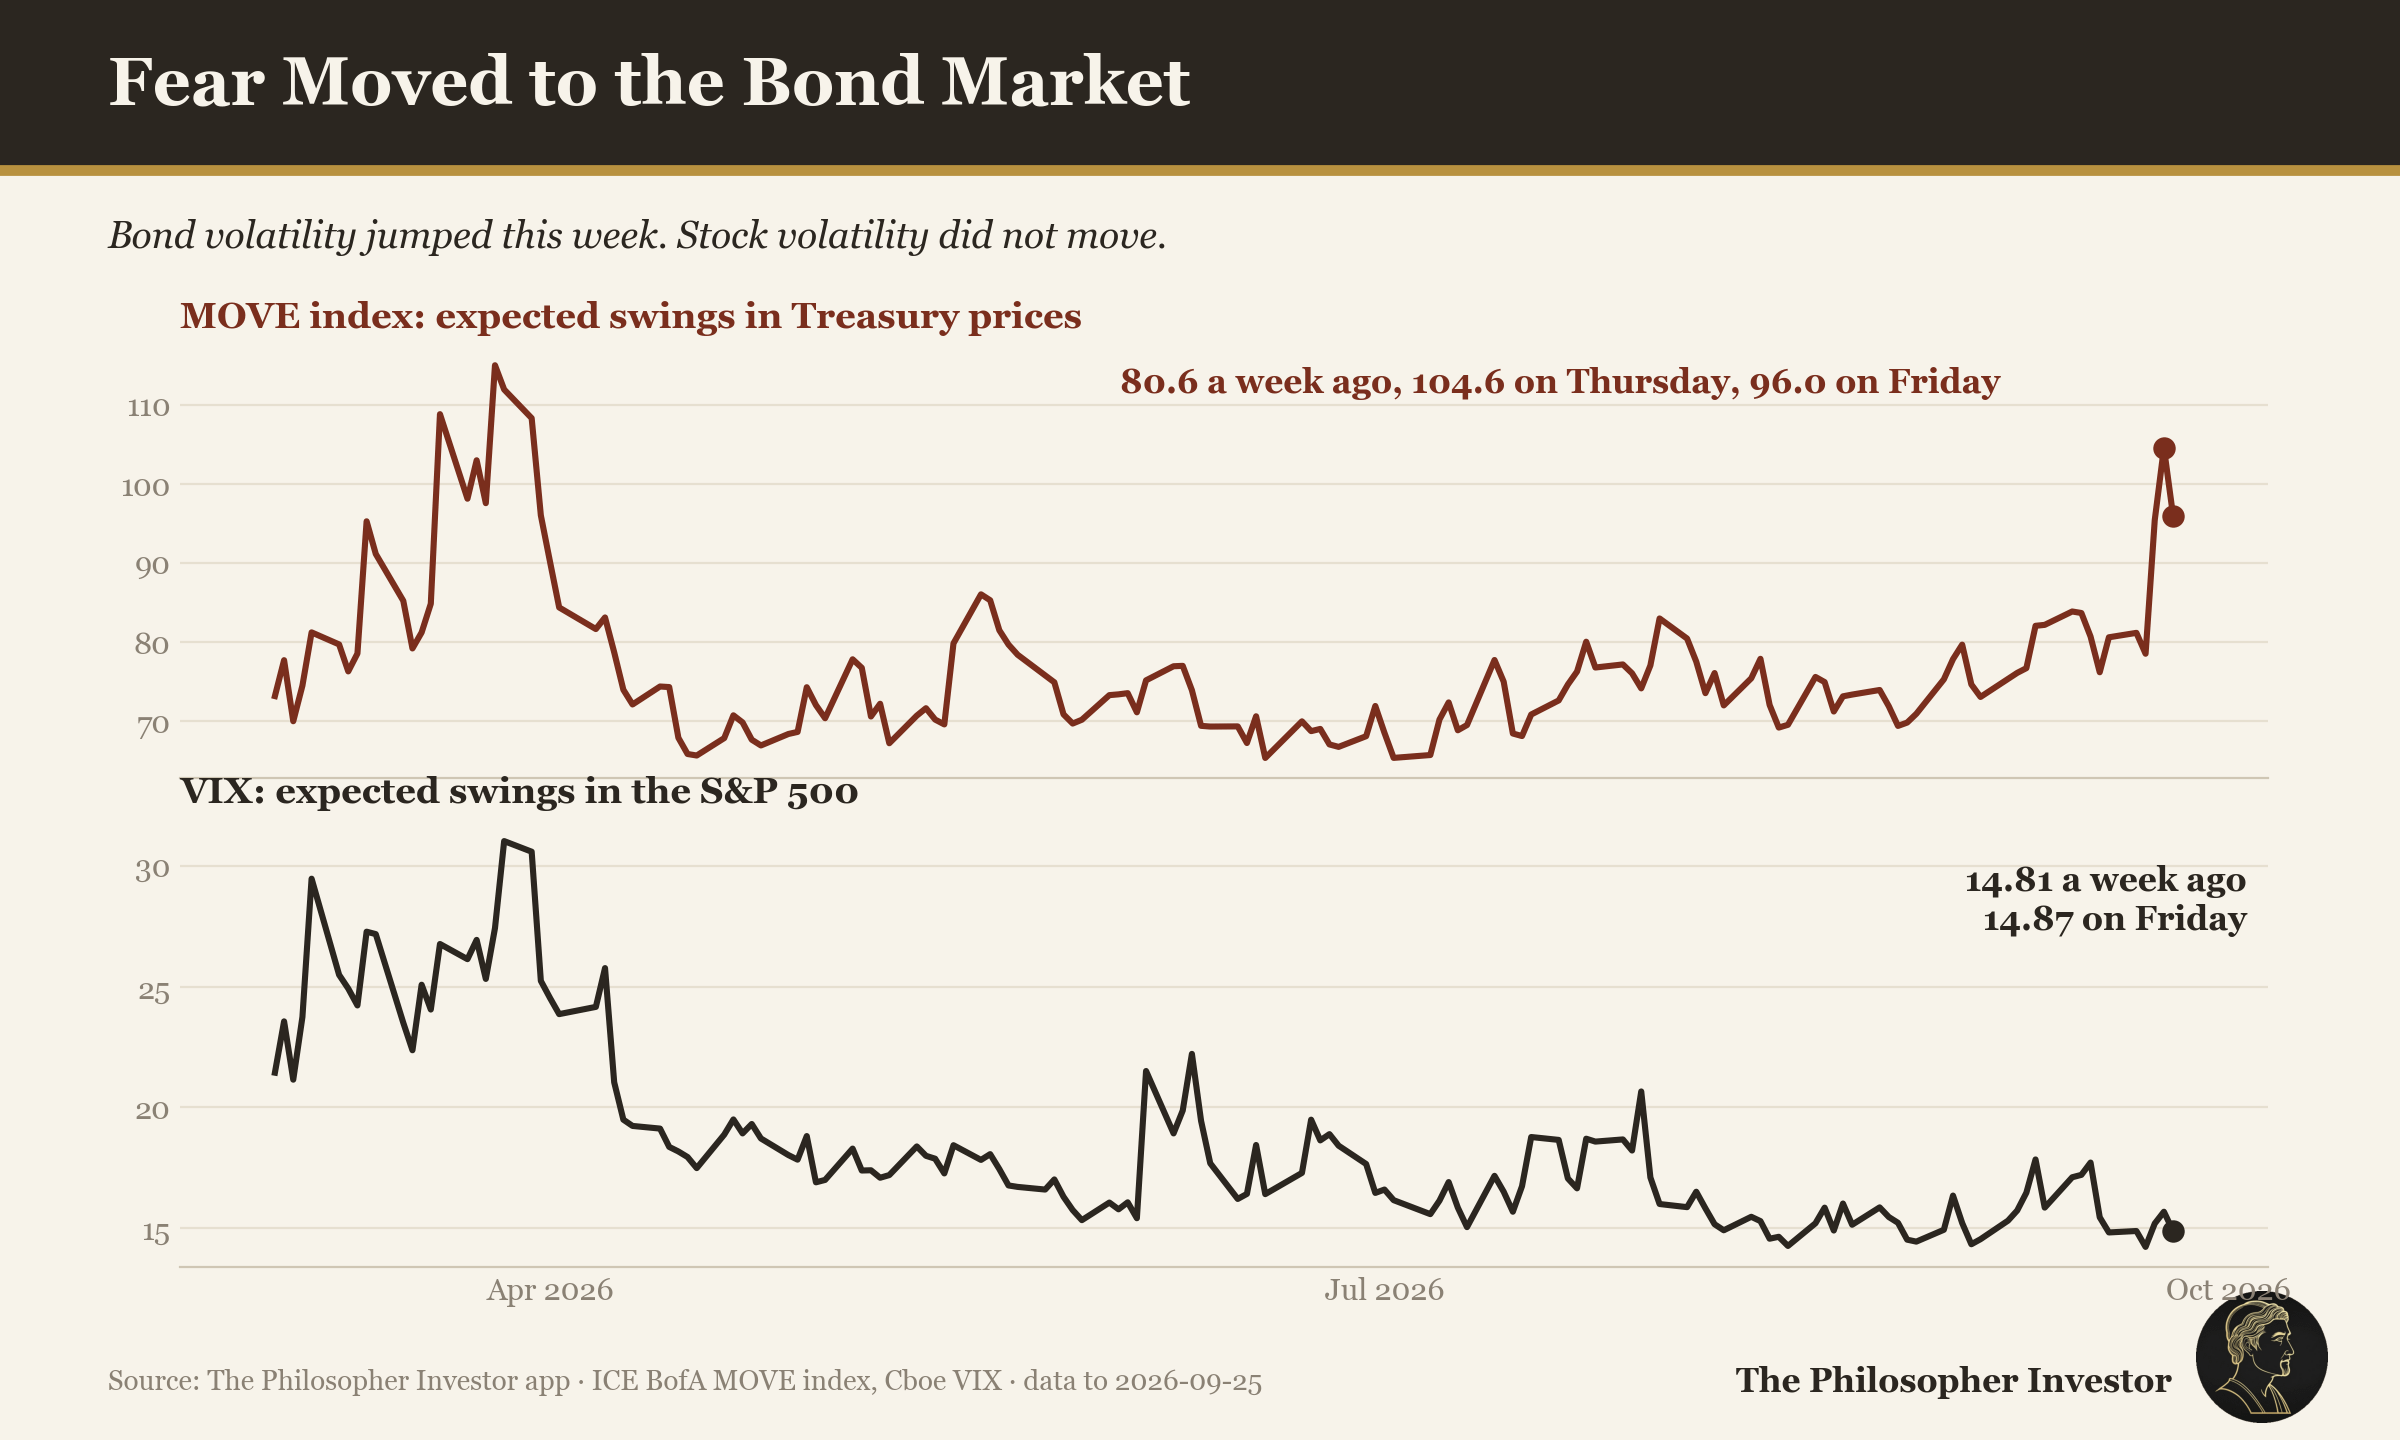
That gap says where the risk sits. Bond traders now pay for protection against a 10-year that keeps climbing. Stock traders do not, because the index kept rising on a handful of names. A VIX near 15 prices a move of about 1% a day for the S&P 500. If yields keep rising, stocks have to catch up with bonds, and a VIX this low says that repricing has not started.
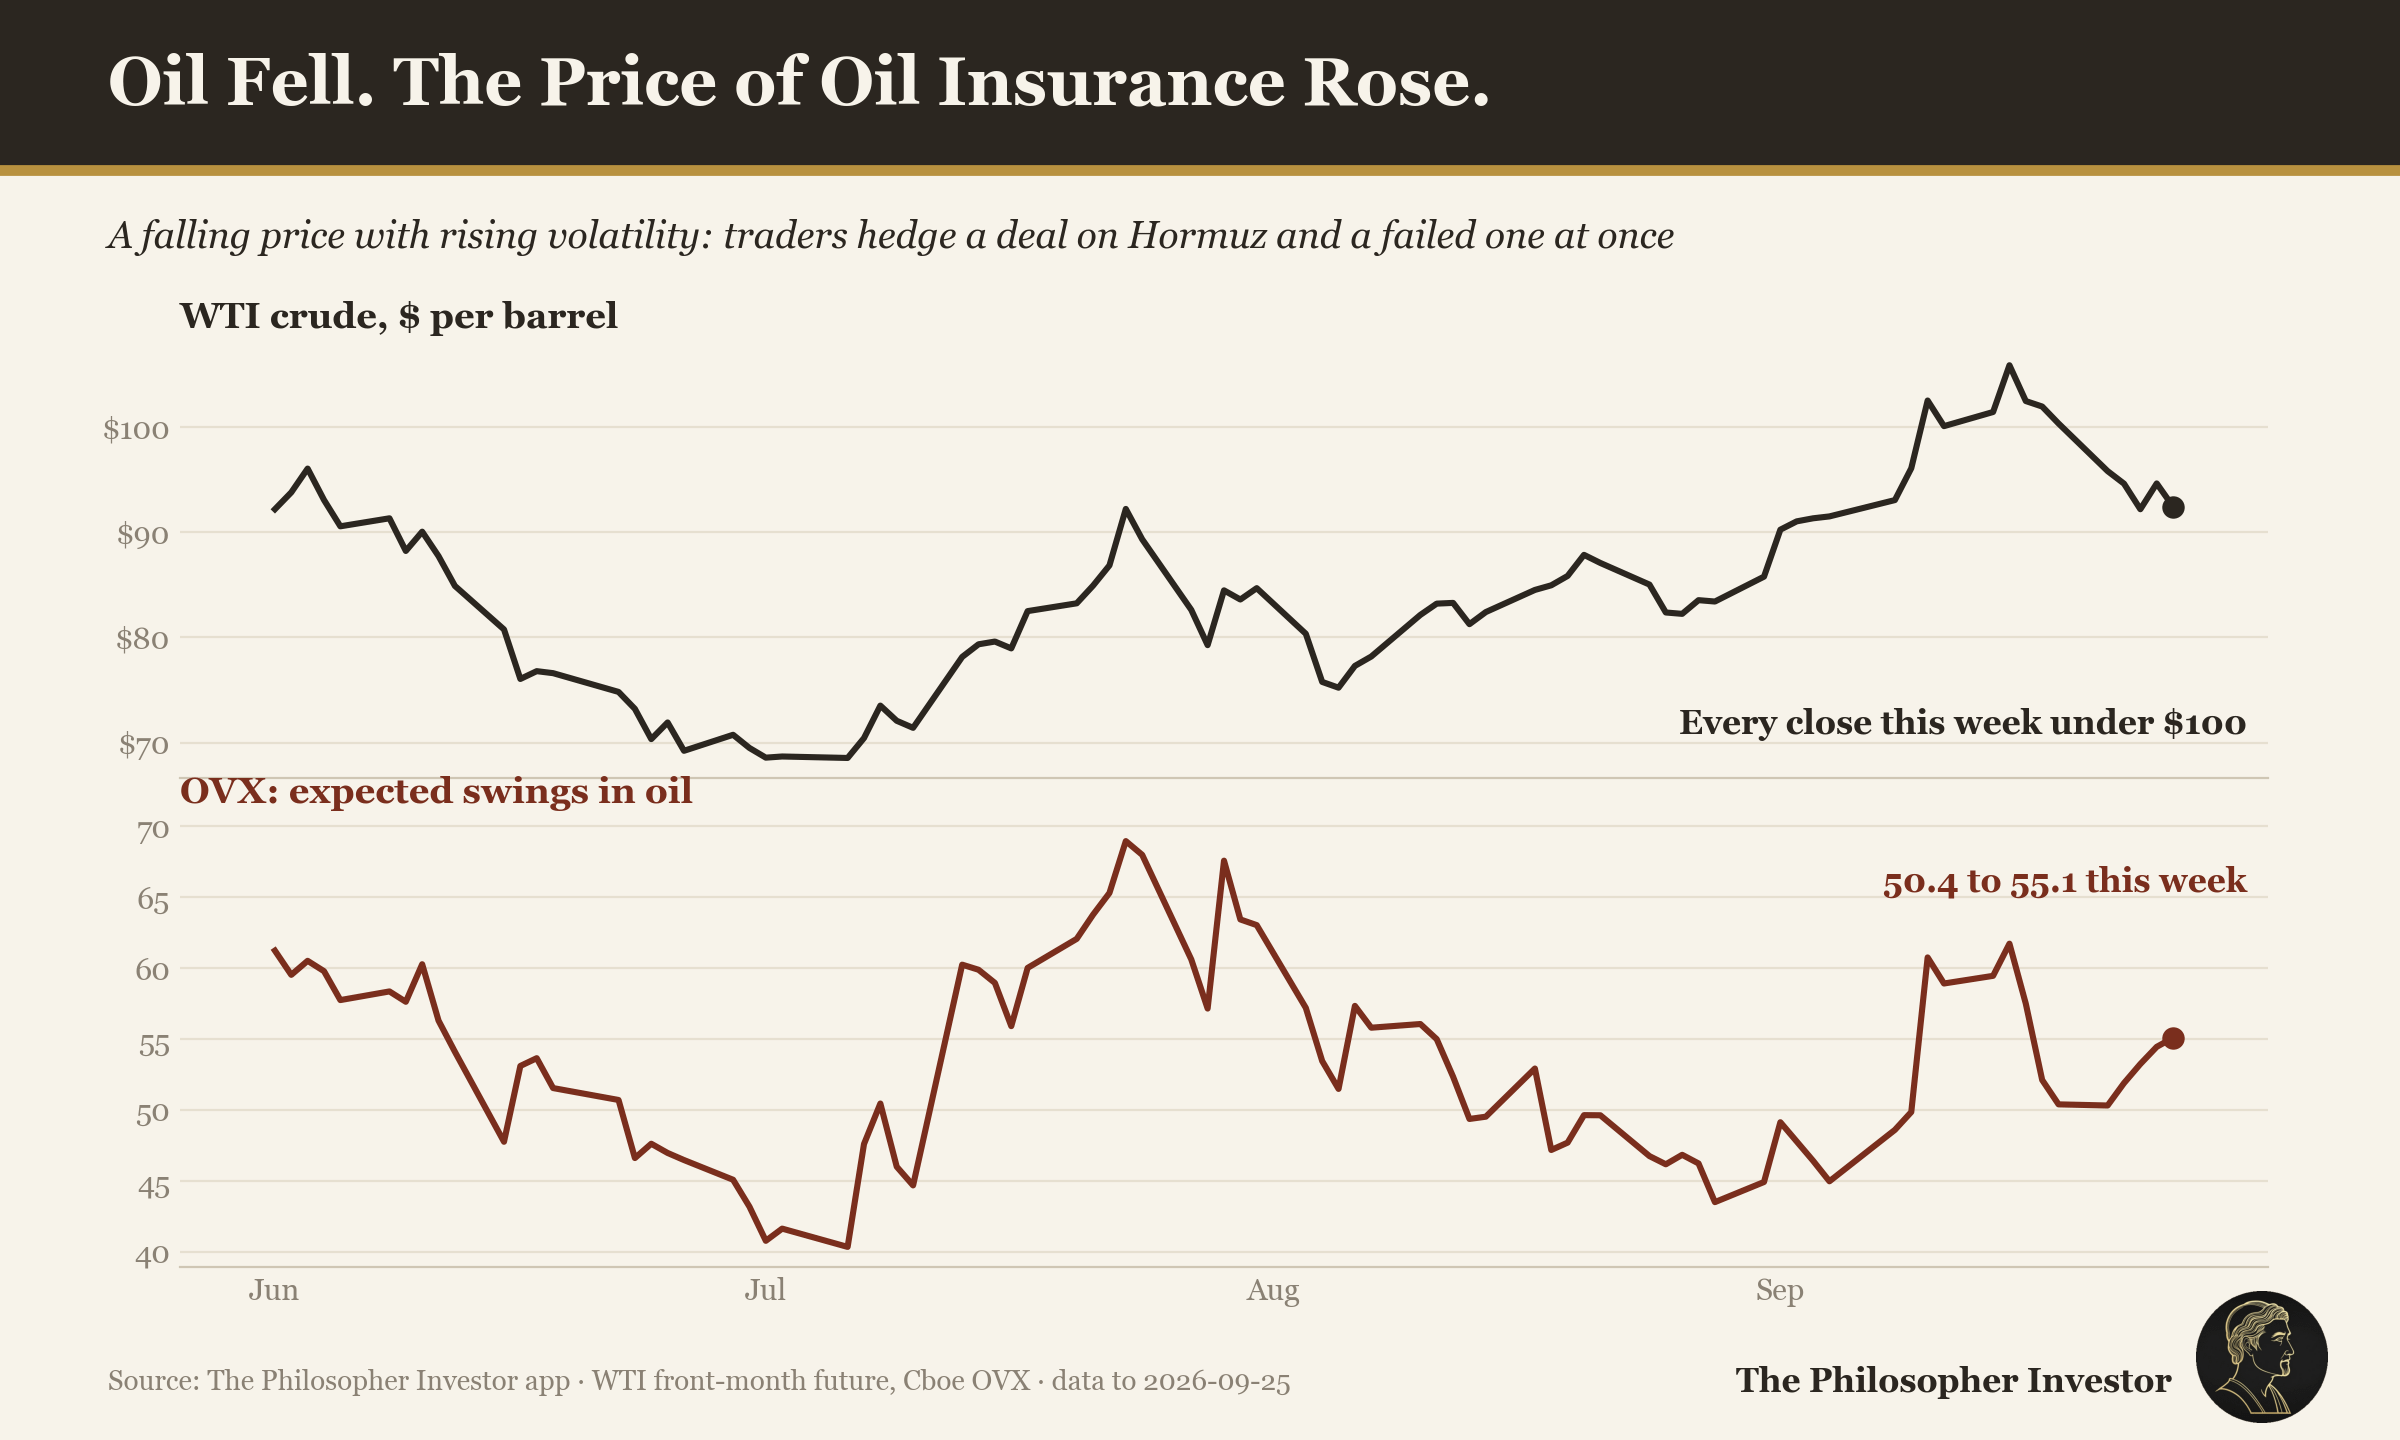
Oil shows the other kind of fear. WTI fell 7.8%, and the OVX, its volatility index, rose from 50.4 to 55.1. A price usually gets calmer as it falls. This one got more nervous, because traders buy protection on both sides. A deal on Hormuz sends the barrel lower, a failed one sends it back above $100, and nobody knows which comes first.
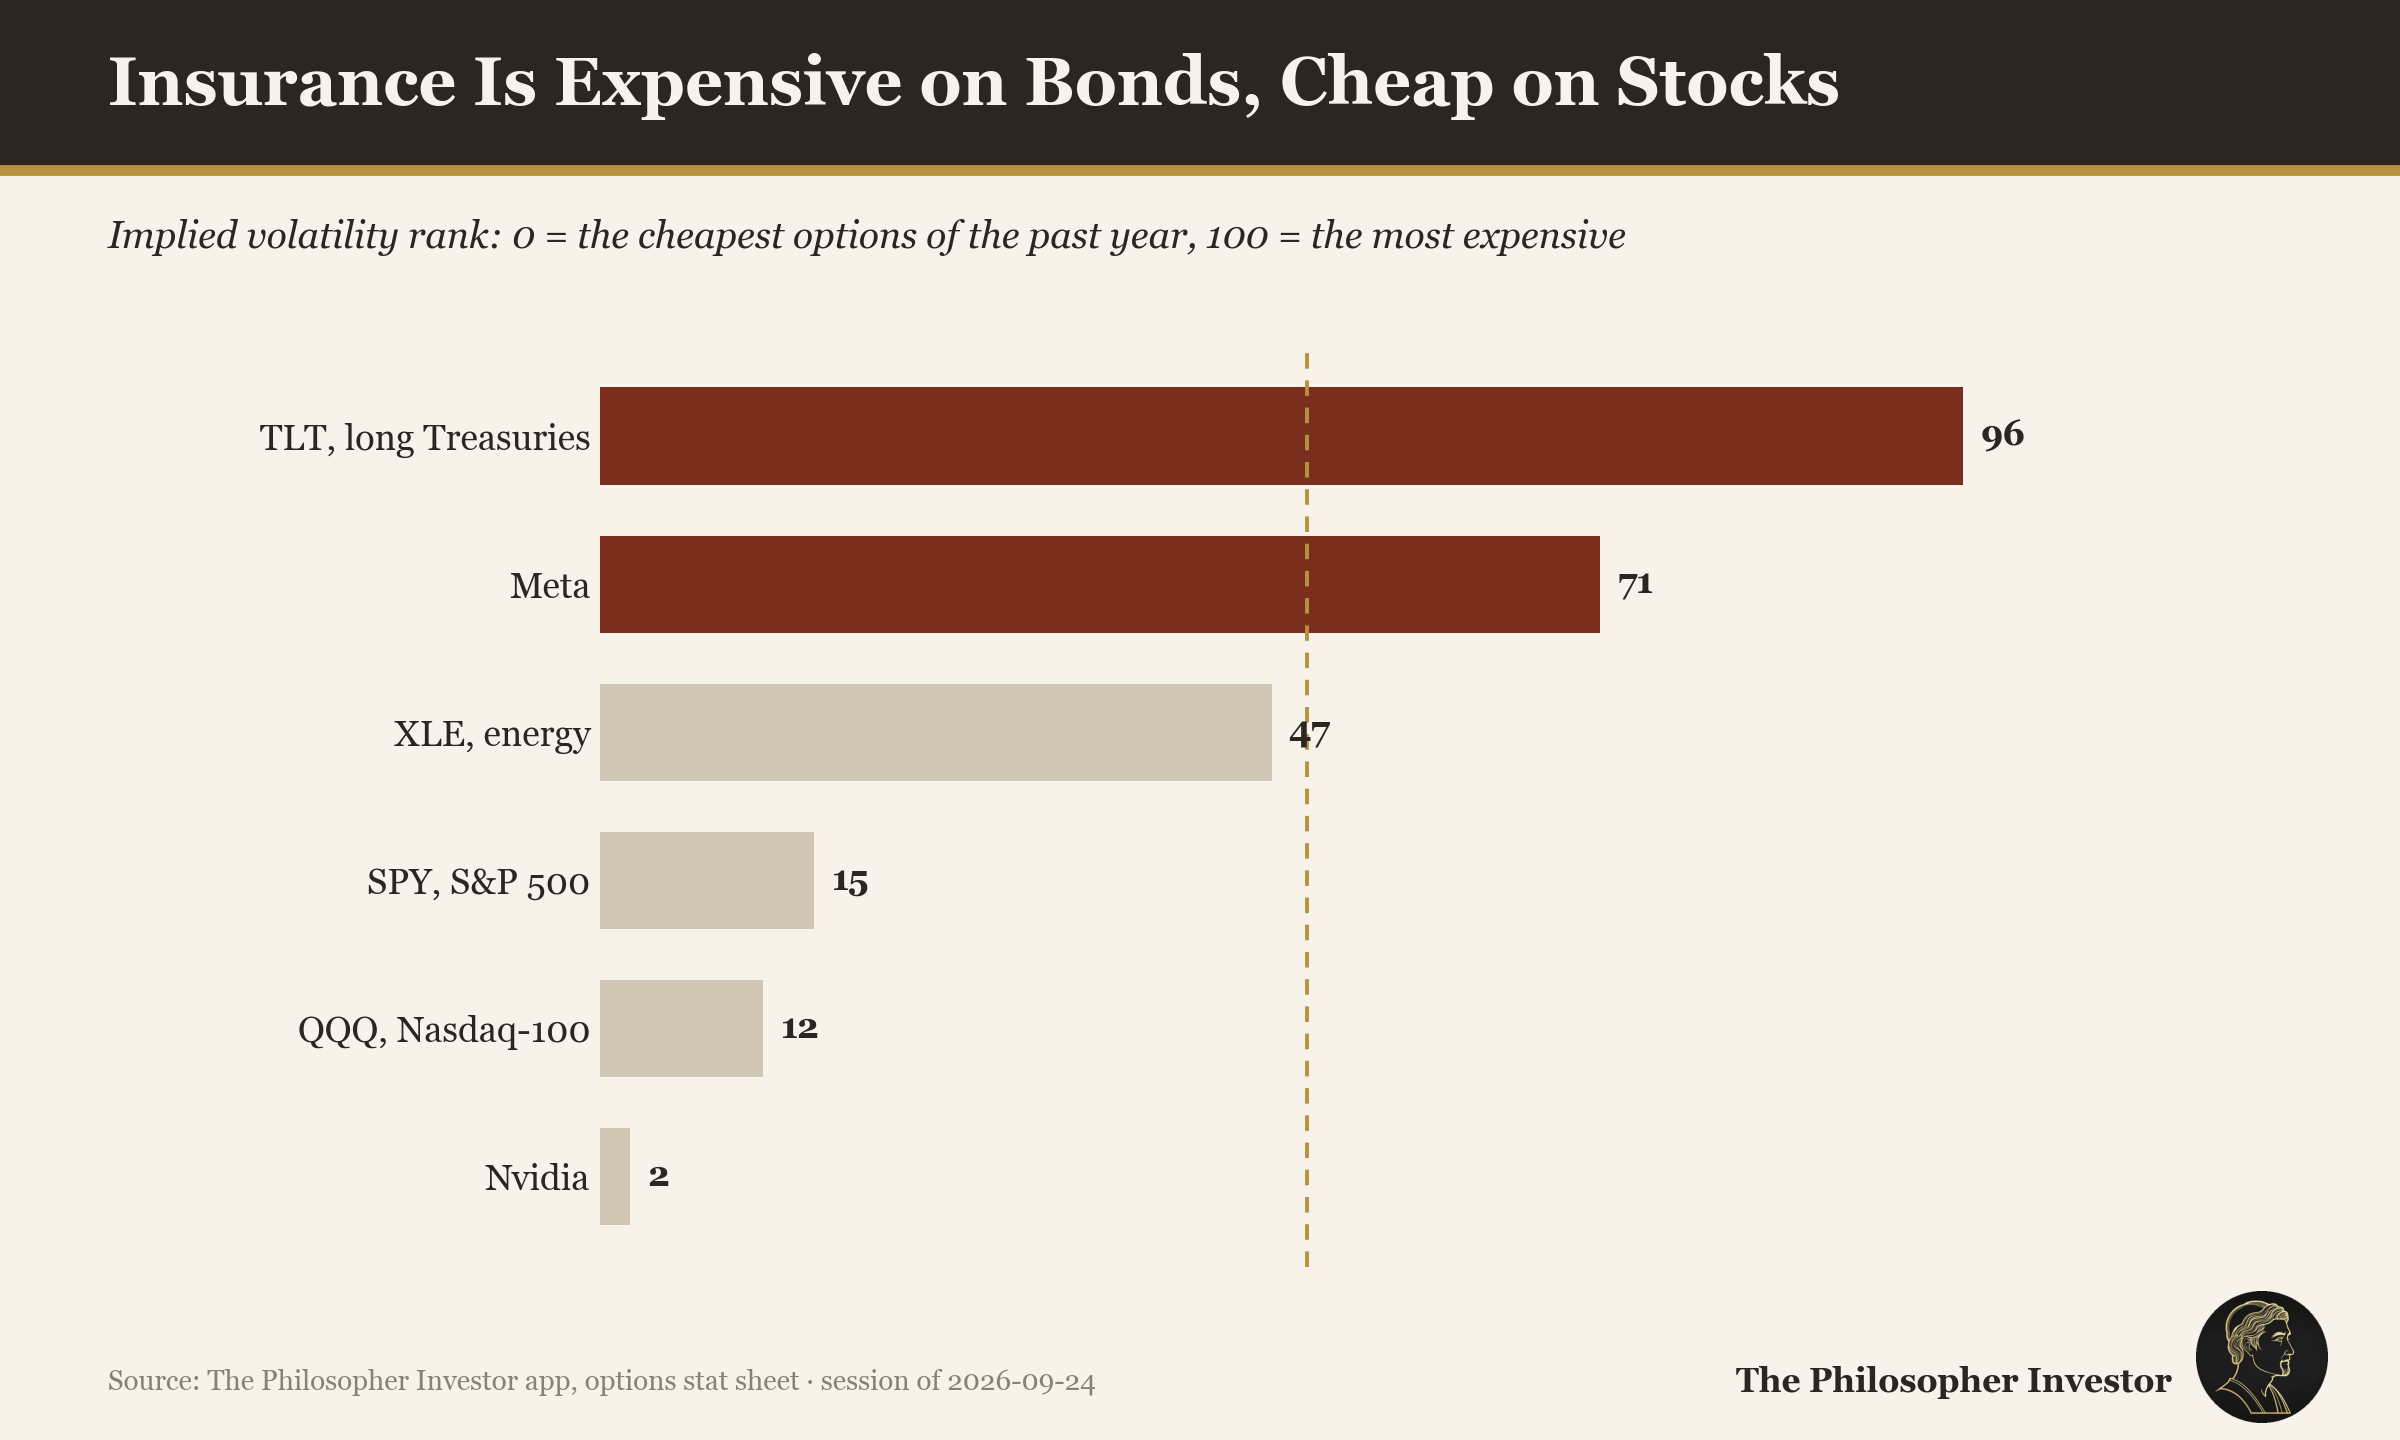
The implied volatility rank compares what options cost today with their range over the past year: 0 is the cheapest, 100 the most expensive. Options on TLT, the long Treasury fund, sit at 96. XLE, the energy fund, sits at 47. SPY sits at 15, QQQ at 12 and Nvidia at 2. Insurance costs the most where the damage happened, and the least on the index that made a record. If you want to hedge a stock portfolio, this is when it costs the least.
The Nasdaq rally was bought with calls. The put-call ratio on stocks fell to 0.64 on Monday and Tuesday, then went back to 0.80 on Wednesday, the day the 10-year crossed 5.1%. The VXN, the volatility index of the Nasdaq-100, rose from 19.29 to 20.87 while the index gained 3.3%. Implied volatility usually falls when an index rises. When it rises with it, buyers are paying up for upside, and a rally bought that way needs new buyers every week to hold.
The dealer map shows how the index got through its ceiling. A week ago the ceiling on SPY, the strike where dealers hold the most calls, sat at 770, and the floor at 753. SPY closed above 770 on Monday, and the ceiling moved up to 785. Dealers who sold those calls have to buy SPY as it rises to stay hedged, so their buying pushed the price through the level instead of stopping it. That is why I read the walls as this week's levels only.
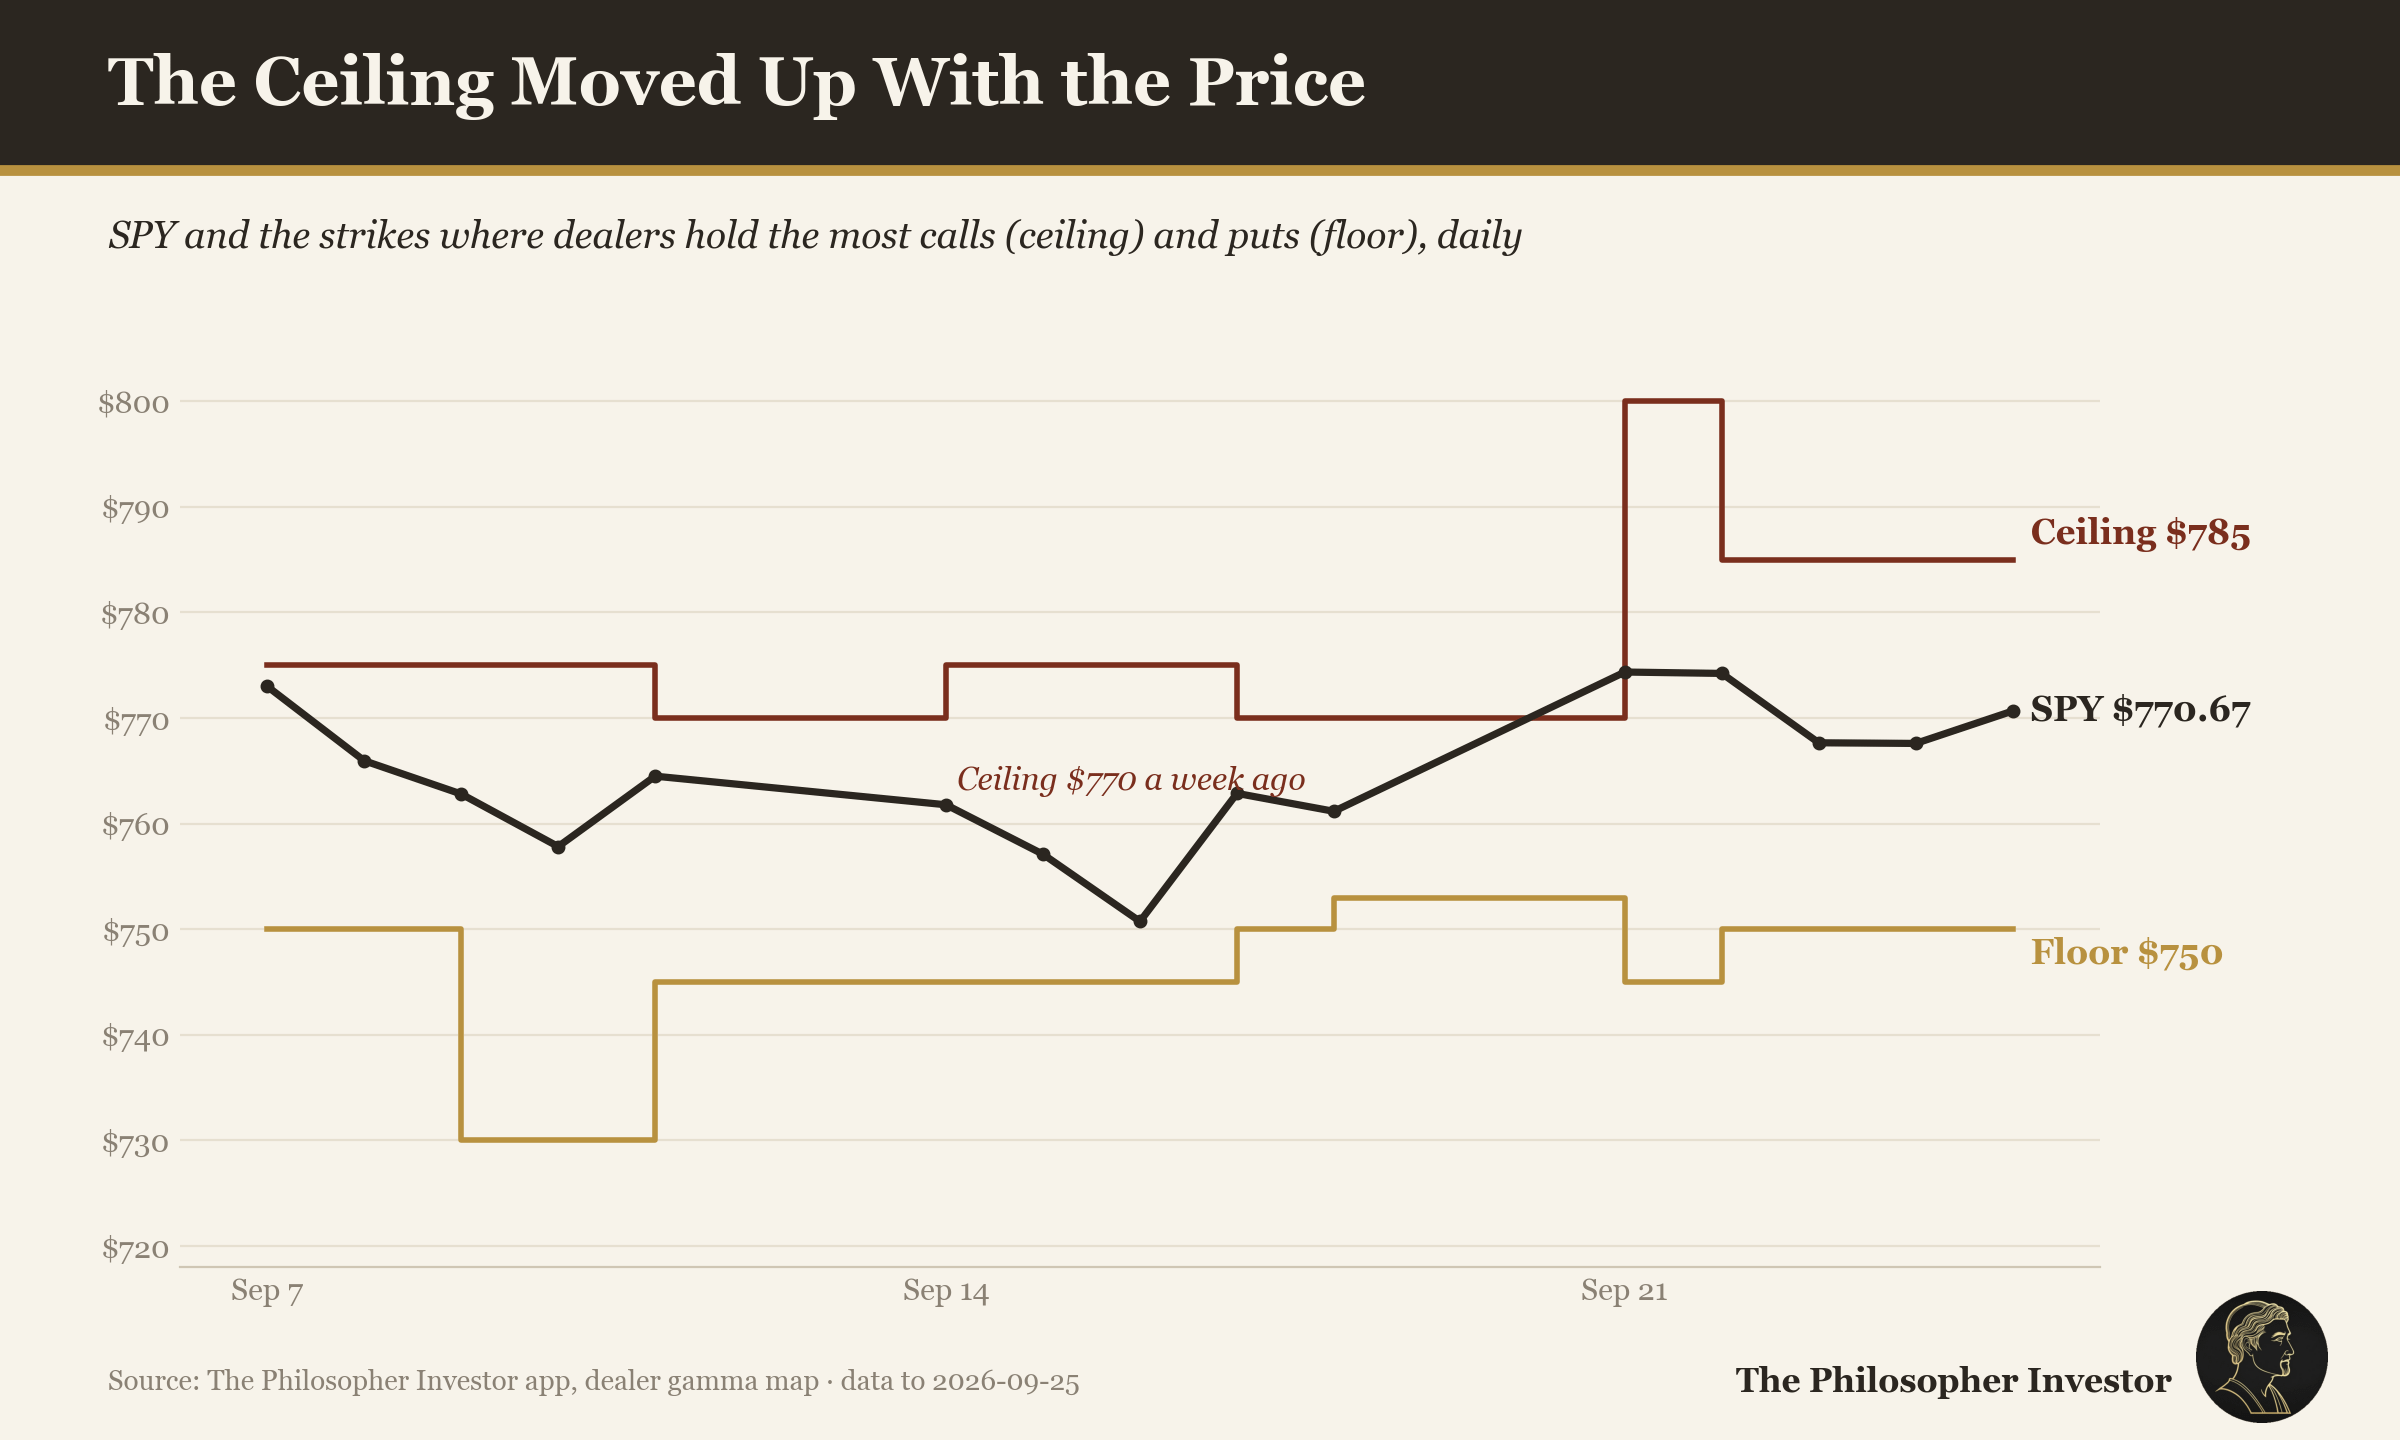
Dealers are still short gamma on SPY between 750 and 785, so their hedging adds to moves in both directions. On QQQ they are long gamma between 700 and 760, and their hedging cushions the Nasdaq-100. Small caps sit in short gamma between 280 and 290, with no cushion. It is the same split as the rest of this letter: the largest names have support under them this week, and the rest of the market does not.
💱 FX
The dollar rose with US yields. The yen fell four days, then Tokyo’s warning bought it one.
The dollar index gained 0.8% to 101.04. With the 10-year above 5% and another Fed hike priced in, holding dollars pays more every week, and the euro slipped to 1.139.
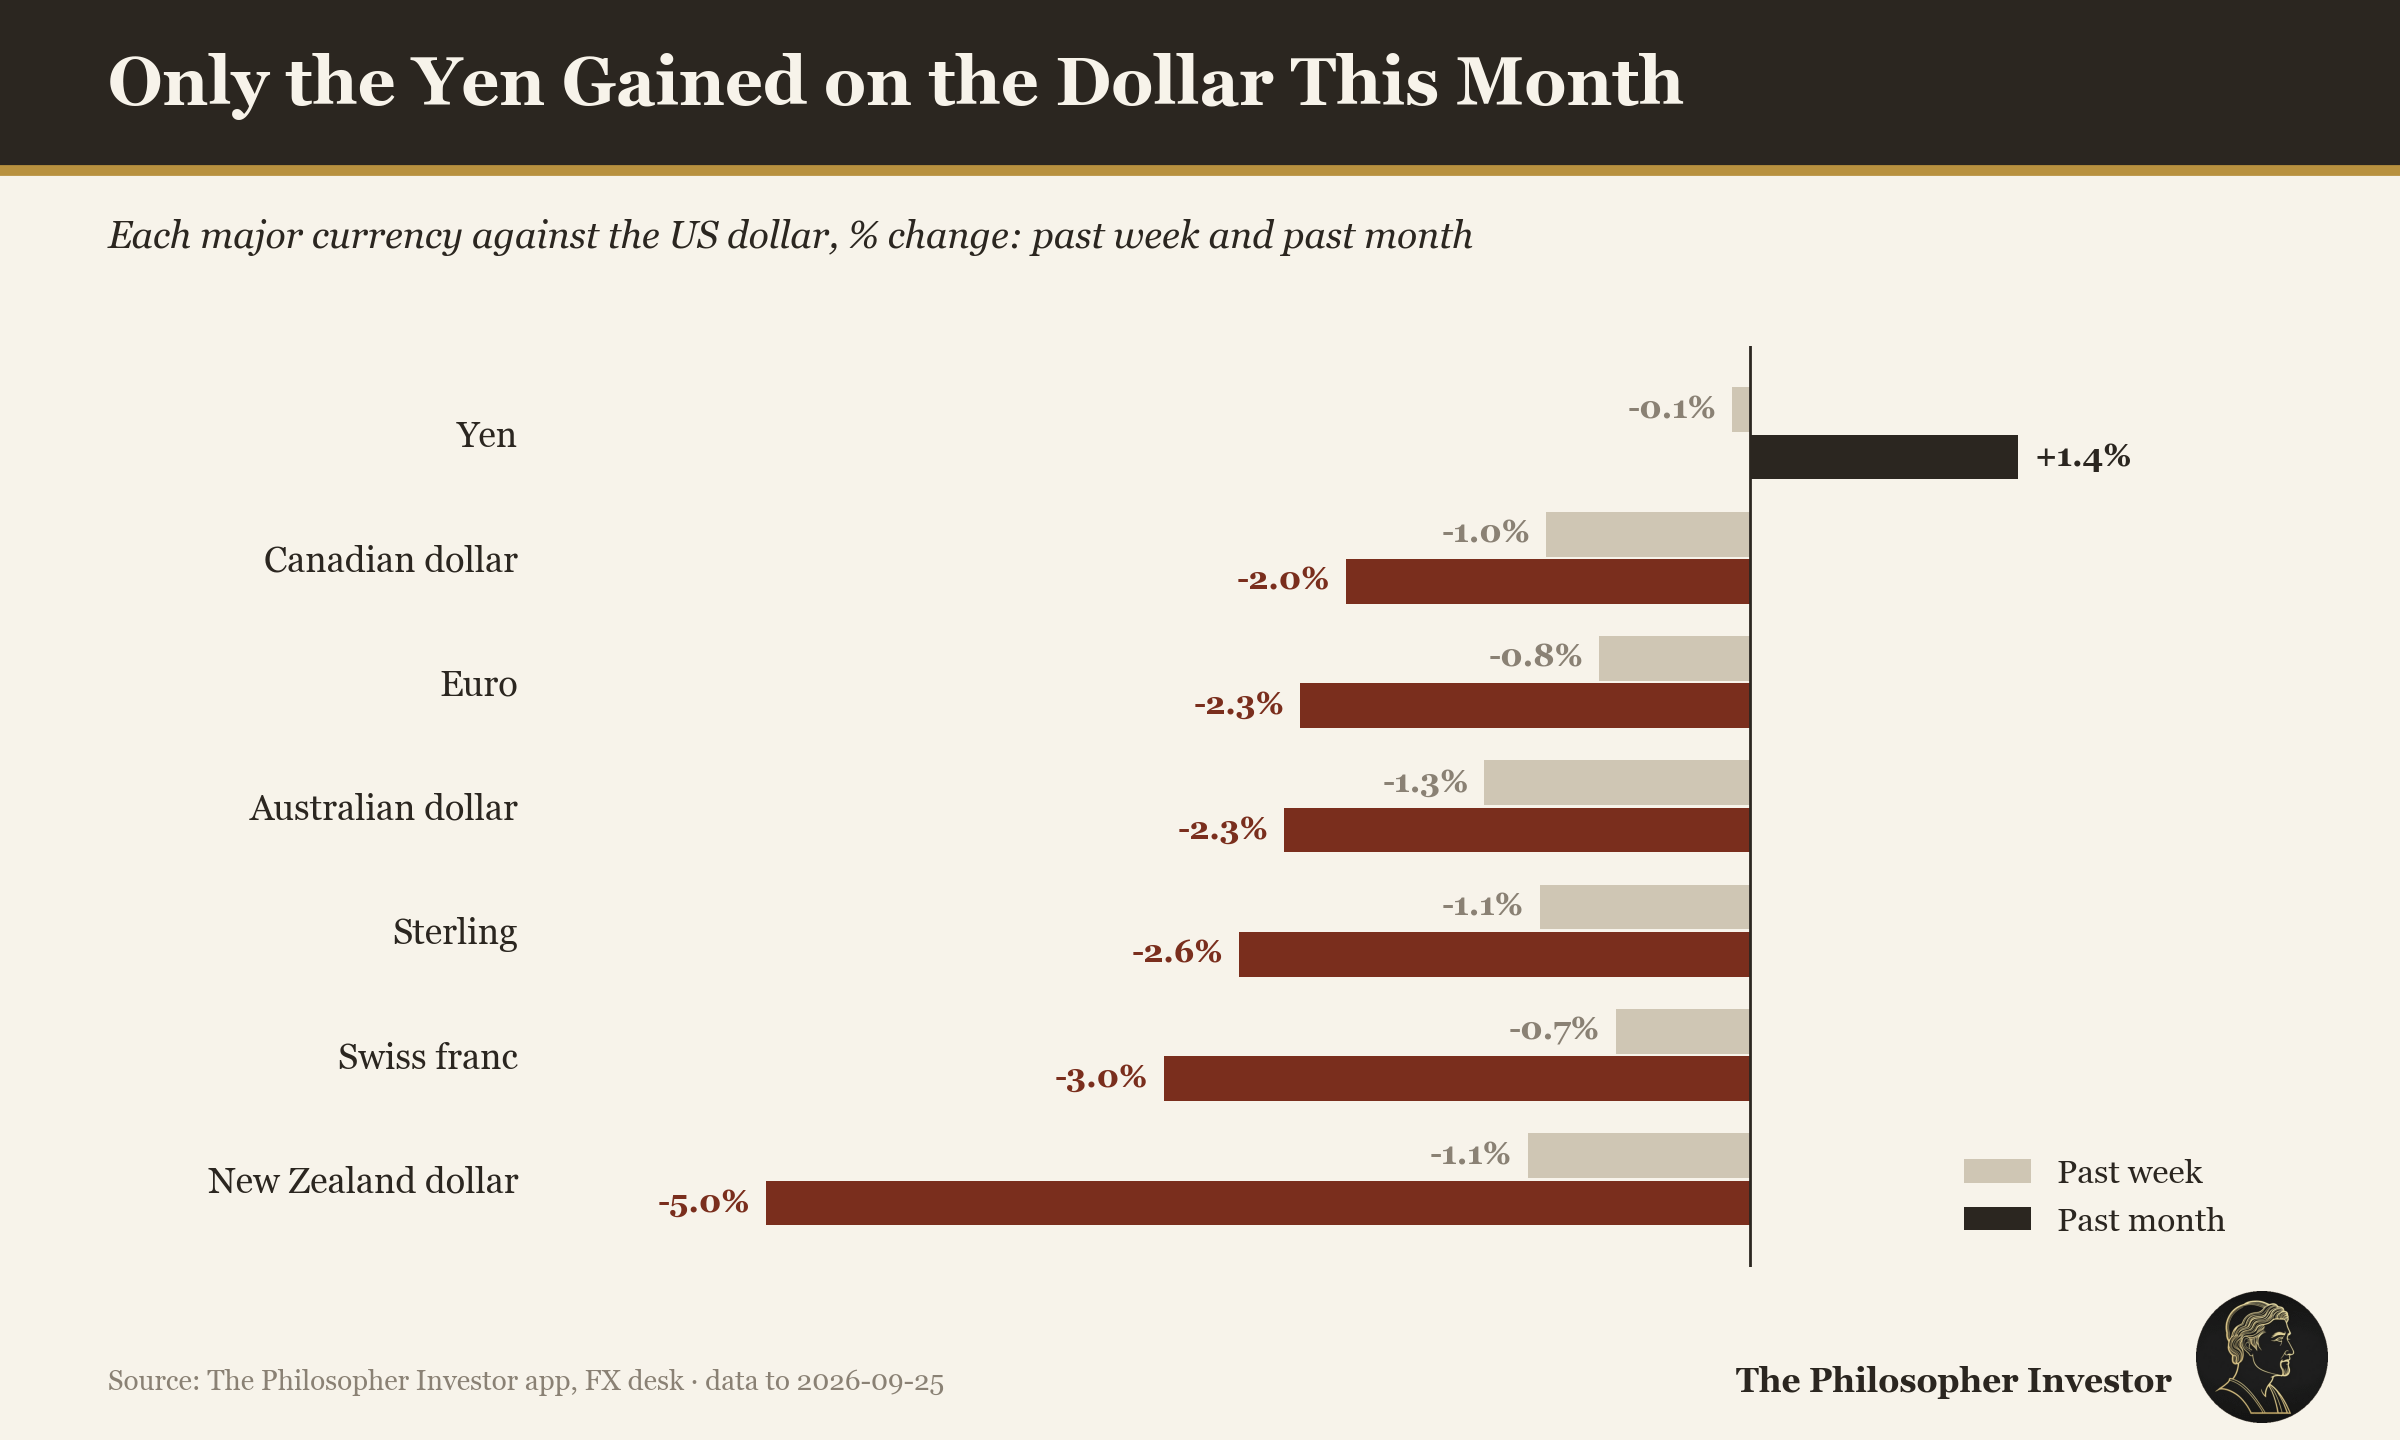
After the Bank of Japan raised rates on September 18, the yen fell four sessions in a row, from 156.87 to 158.84 to the dollar on Thursday. Ueda's press conference first drew yen buyers, and the move reversed. On Thursday Tokyo repeated its warning about the currency, and on Friday the yen gained 1% back to 157.18. So the week ended flat, but only because of one day of words from Tokyo. A carry trade funded in yen gets more attractive when US yields rise faster than Japanese ones, which is what happened this week.
Over one month the yen is the only major currency that gained on the dollar, +1.4%. Every other one lost between 2.0%, the Canadian dollar, and 5.0%, the New Zealand dollar. Over the week they all gave ground: sterling -1.1%, the euro -0.8%. The month carries the run into the Bank of Japan hike. The week carries a Fed that says it has more hikes in mind.
Last week I wrote that the unwind risk was off the table until the yen turns. It has not turned. The variable to watch now is an intervention from Tokyo, which would lift the yen in hours and force the carry trade to close in the same hours.
Gold futures fell 2.4% to $4,320. Gold pays no coupon, and a Treasury paying above 5% makes it more expensive to hold.
🔥 Trade of the Week:
Cooper makes contact lenses, and runs a second business in fertility and women’s health. On September 9, after the close, it gave investors two disappointments at once: a lower outlook for the year, and the news that it would keep that second business after a strategic review.
Quarterly revenue: $1.07 billion, 1% more than a year ago, short of the $1.1 billion analysts expected
Revenue outlook for the year: cut to $4.24 billion at the midpoint, from $4.30 billion
Adjusted earnings still expected: $4.53 a share
The next morning: the stock opened 18% lower, on 9 times its normal volume
Then the people on its board started buying. Three directors bought about $1.9 million of stock in the open market, between $53.18 and $54.93. My Insider Buys screener has flagged it every session since September 15, and my Bottom screener since September 14.
The price now asks very little of the company:
About 12 times the $4.53 it still expects to earn this year
38% under its 52-week high, for a product customers buy again every month
The analysts’ average target is $66.21, 20% above Friday’s close of $55.38
Options are cheap, an implied volatility rank of 15/100: nobody is paying up for a rebound yet
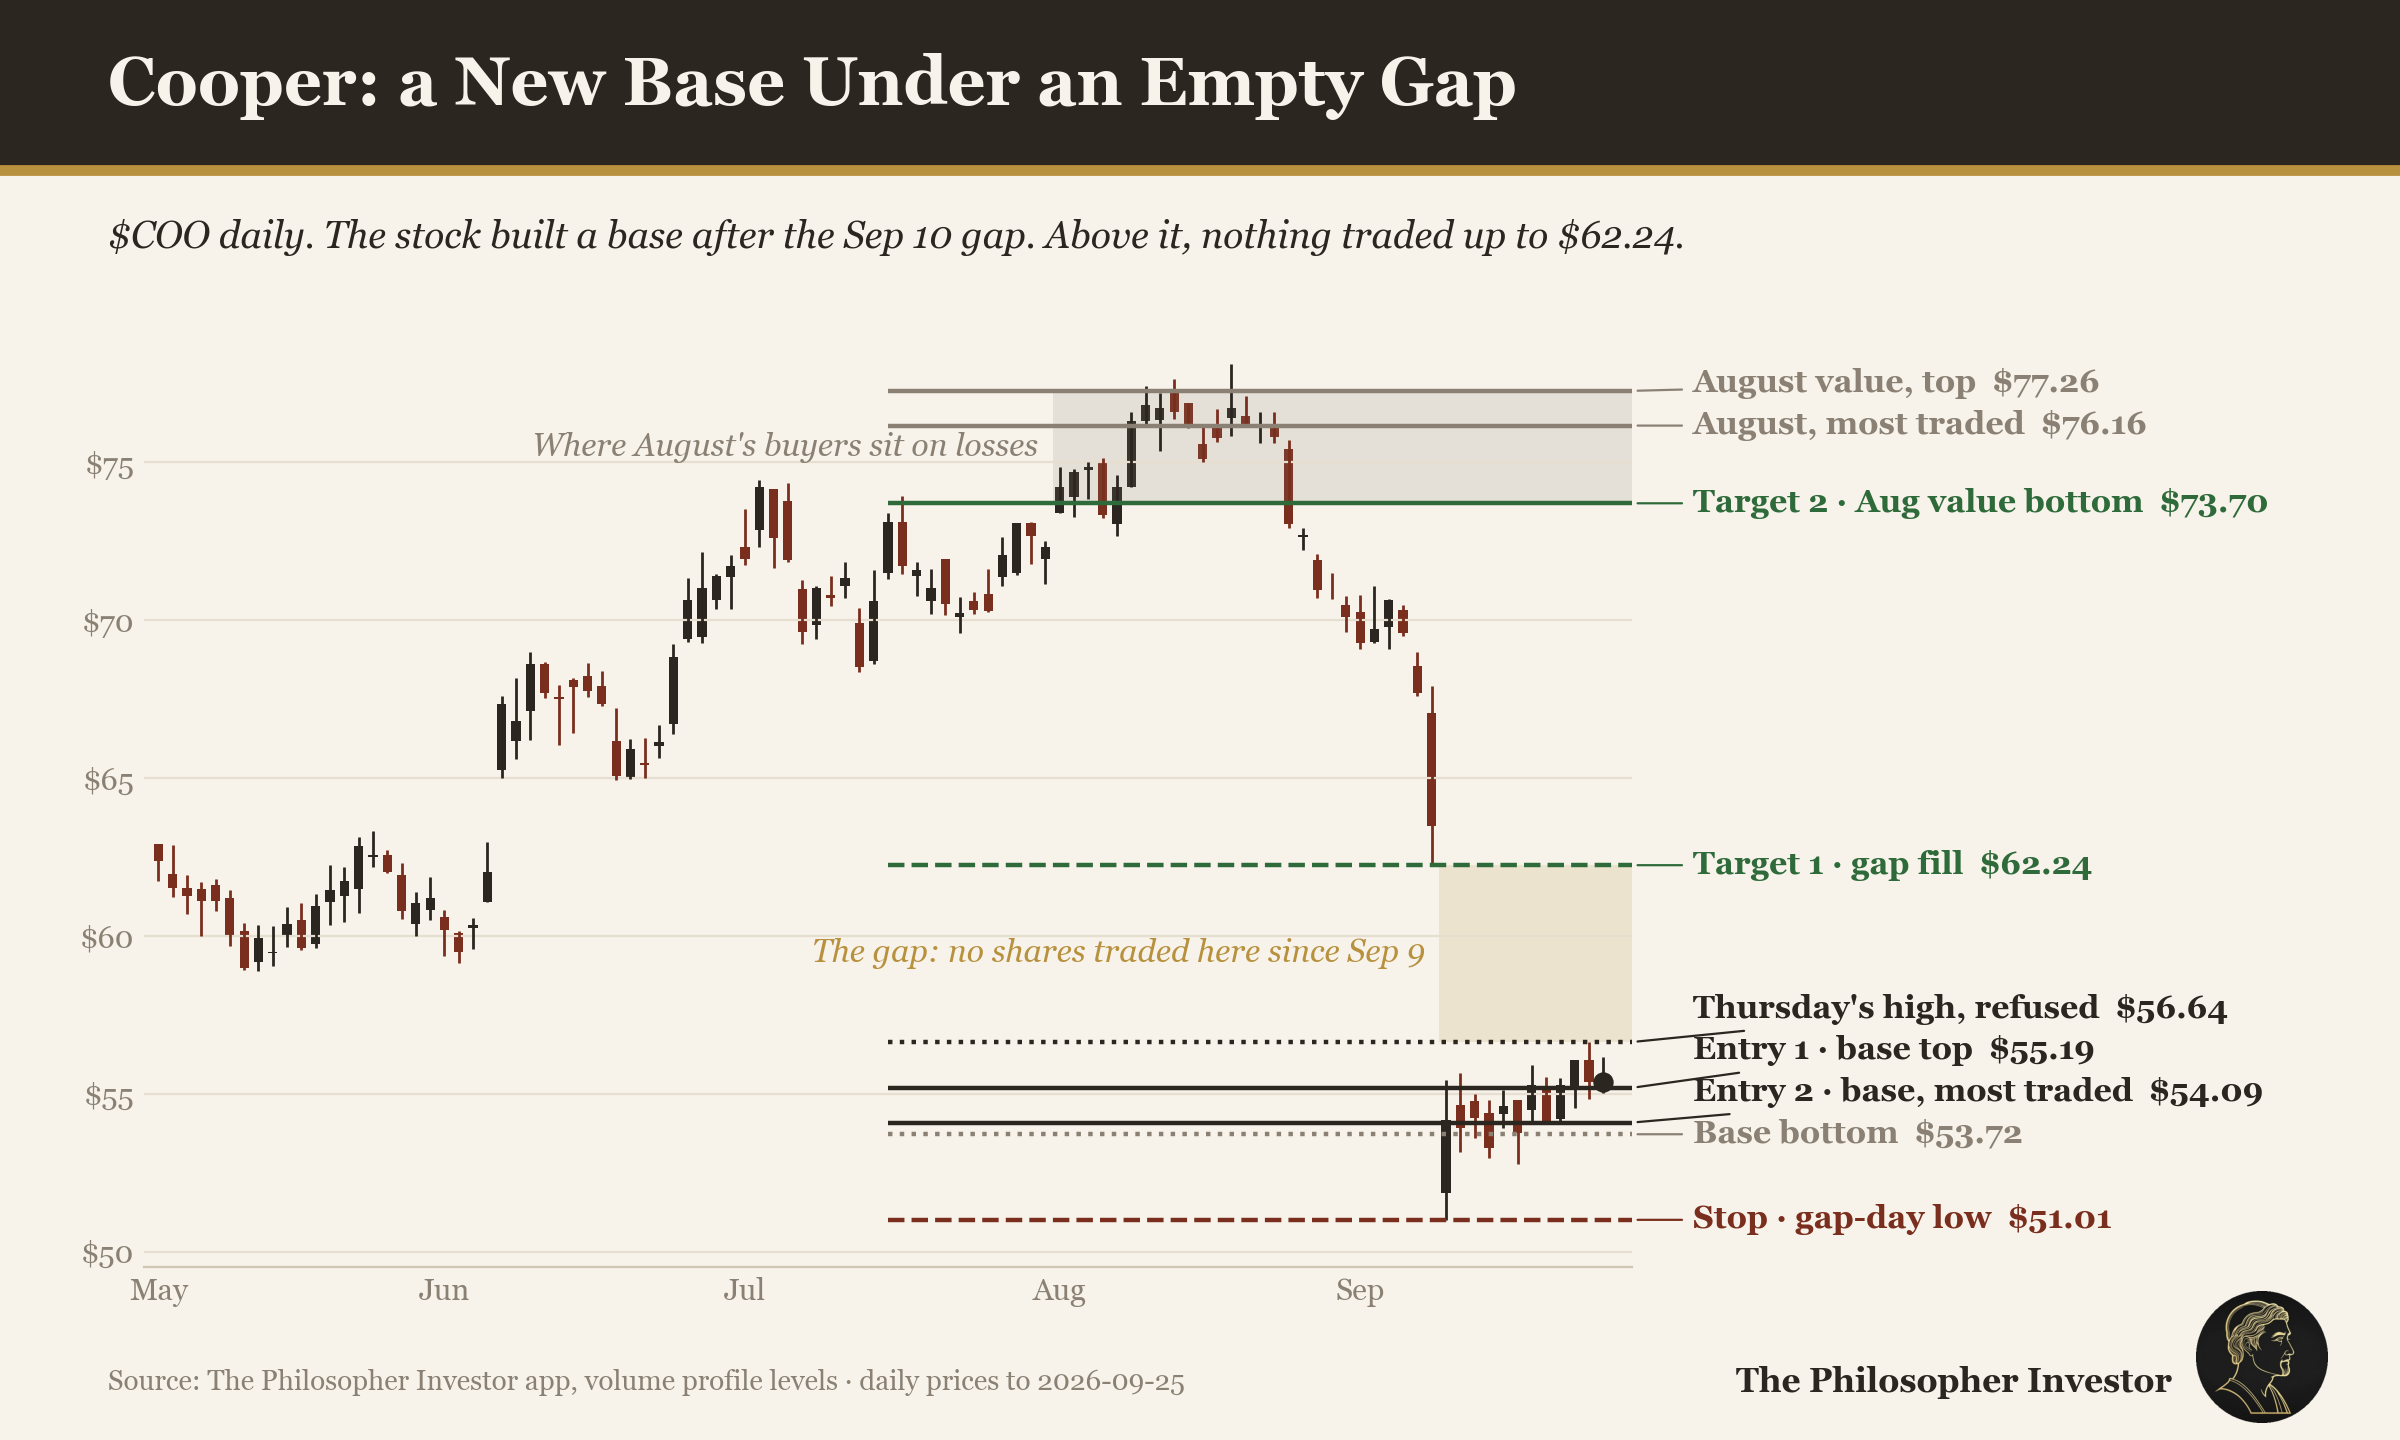
The volume profile tells the rest. Since the gap, the stock has built a new base: last week most shares traded between $53.72 and $55.19, and the most traded price was $54.09. On Thursday buyers pushed to $56.64 and sellers refused it. On Friday the stock dipped to $55.02, held above the top of the base and closed at $55.38. Buyers now defend the top of the base, where a week ago they only defended its bottom.
Above $56.64 sits the gap, up to $62.24, the low of September 9. Not one share has traded there since. No trading means no one bought there and waits to get out, so a break of $56.64 can travel fast. The real wall stands higher, between $73.70 and $77.26, where most shares traded in August. The buyers of the summer sit there on losses of 25% to 28%, and they will sell to get out even.
This is a base trade under an old wall, so I trade it at half size, and the plan depends on what the stock does first:
If it pulls back to $55.19, the top of the base: I buy half. That is where Friday’s dip found buyers
If it falls to $54.09, the most traded price of the base: I buy the other half
If it closes above $56.64 before any pullback: the base has broken up, and I buy a quarter there. From that price the first target pays only 1.0 times the risk, so the size stays small
Stop: a close under $51.01, the gap day’s low. Nothing below it held the stock, so the exit may slip
Target 1: $62.24, the top of the gap. 1.7 times the risk from $55.19, 2.6 from $54.09
Target 2: $73.70, the bottom of August’s value, where the trapped buyers start to sell. 4.4 times the risk from $55.19
More filings from the directors would add to the case. What kills it is a second cut, and the next report is due around December 2, after the stop has had its chance to work.
See you next week,
Daniel
P.S. The app is the daily version of what you just read, the same boards and screeners I run every morning before I trade. It now comes with a free 7-day trial.
Disclaimer
This newsletter is for educational and informational purposes only. It is not financial advice.
The content reflects personal opinions shared publicly as a journal. Trading stocks, options, futures, or any financial instrument involves significant risk. You can lose your entire investment. There is no guarantee of profit.
The author is not a registered investment advisor, broker, or financial professional with any regulatory authority including the SEC or CFTC. Always consult a licensed financial advisor before making any investment decisions.
By reading this newsletter, you accept full responsibility for your own trading and investment choices. Past performance does not guarantee future results. Markets are unpredictable.
Screenshots are courtesy of TradingView, VixCentral, and other platforms with which the author has no affiliation. Information shared may contain errors or become outdated quickly.
This content is the intellectual property of the author. Copying or redistributing without permission is prohibited.
By continuing to read, you acknowledge and accept these terms.
Tickers in this edition, with their free data pages: AMD
Read the desk every week
Market analysis in plain English, plus the app that scans the whole US market for you.
Become a member Read the original on Substack ↗